
Is the high end driving Greenwich’s headline price?
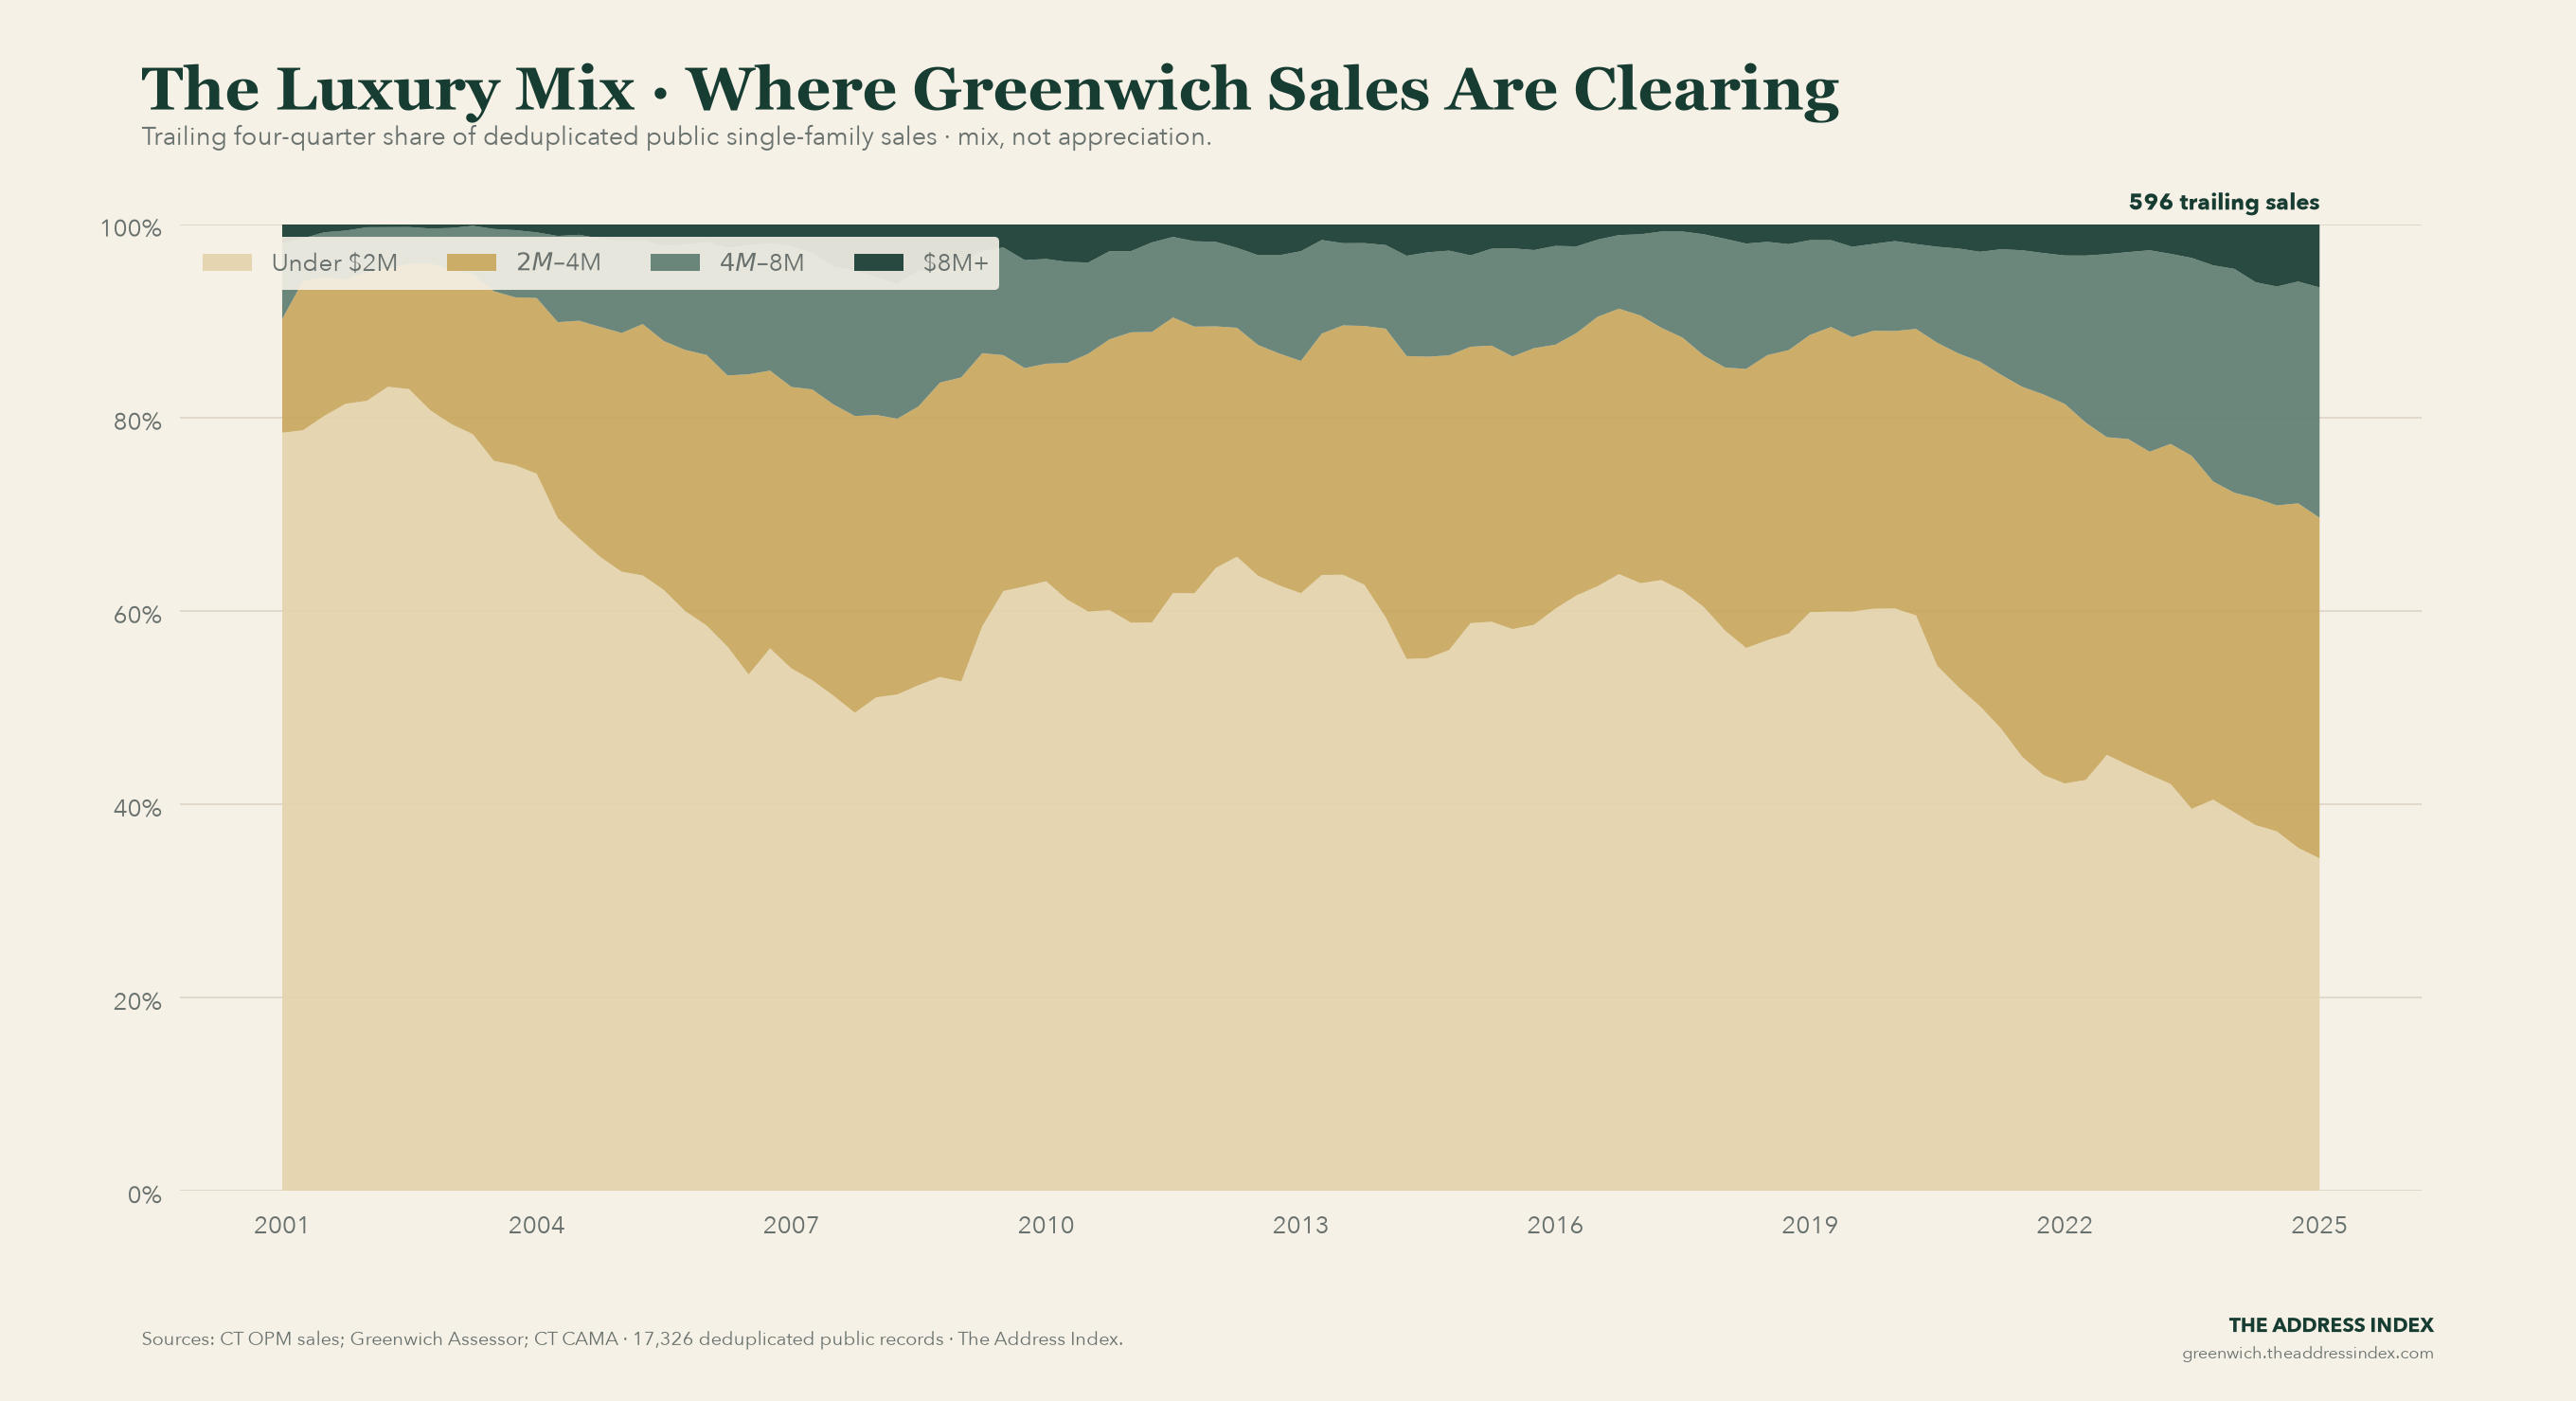
In the trailing year through 2025 Q1, 30.4% of deduplicated public single-family sales cleared $4M, including 6.5% at $8M or more. A richer mix can lift the median even when like-for-like prices move differently.
For buyers: Do not infer appreciation from a median pulled upward by more high-end closings.
For sellers: Use comparable properties and the repeat-sales index before anchoring to the headline median.
For brokers and advisers: Separate price-band mix from price change in every client conversation.
Chart of the week
Explore this chart interactively →
The Luxury Mix · Where Greenwich Sales Are Clearing. In the trailing year through 2025 Q1, 30.4% of 596 deduplicated public sales cleared at $4M or more, including 6.5% at $8M+. This chart measures sales mix, not appreciation.
This is the week’s main finding. Open the interactive version to inspect the full history and its source notes.
The public-record tape
This week’s official-source sweep found 1 Planning & Zoning calendar item above our publication threshold. A posted calendar item records a meeting—not an approval, denial, or withdrawal.
The source links below are the record. Verify any item before relying on it.
Greenwich market dashboard
Explore this chart interactively →
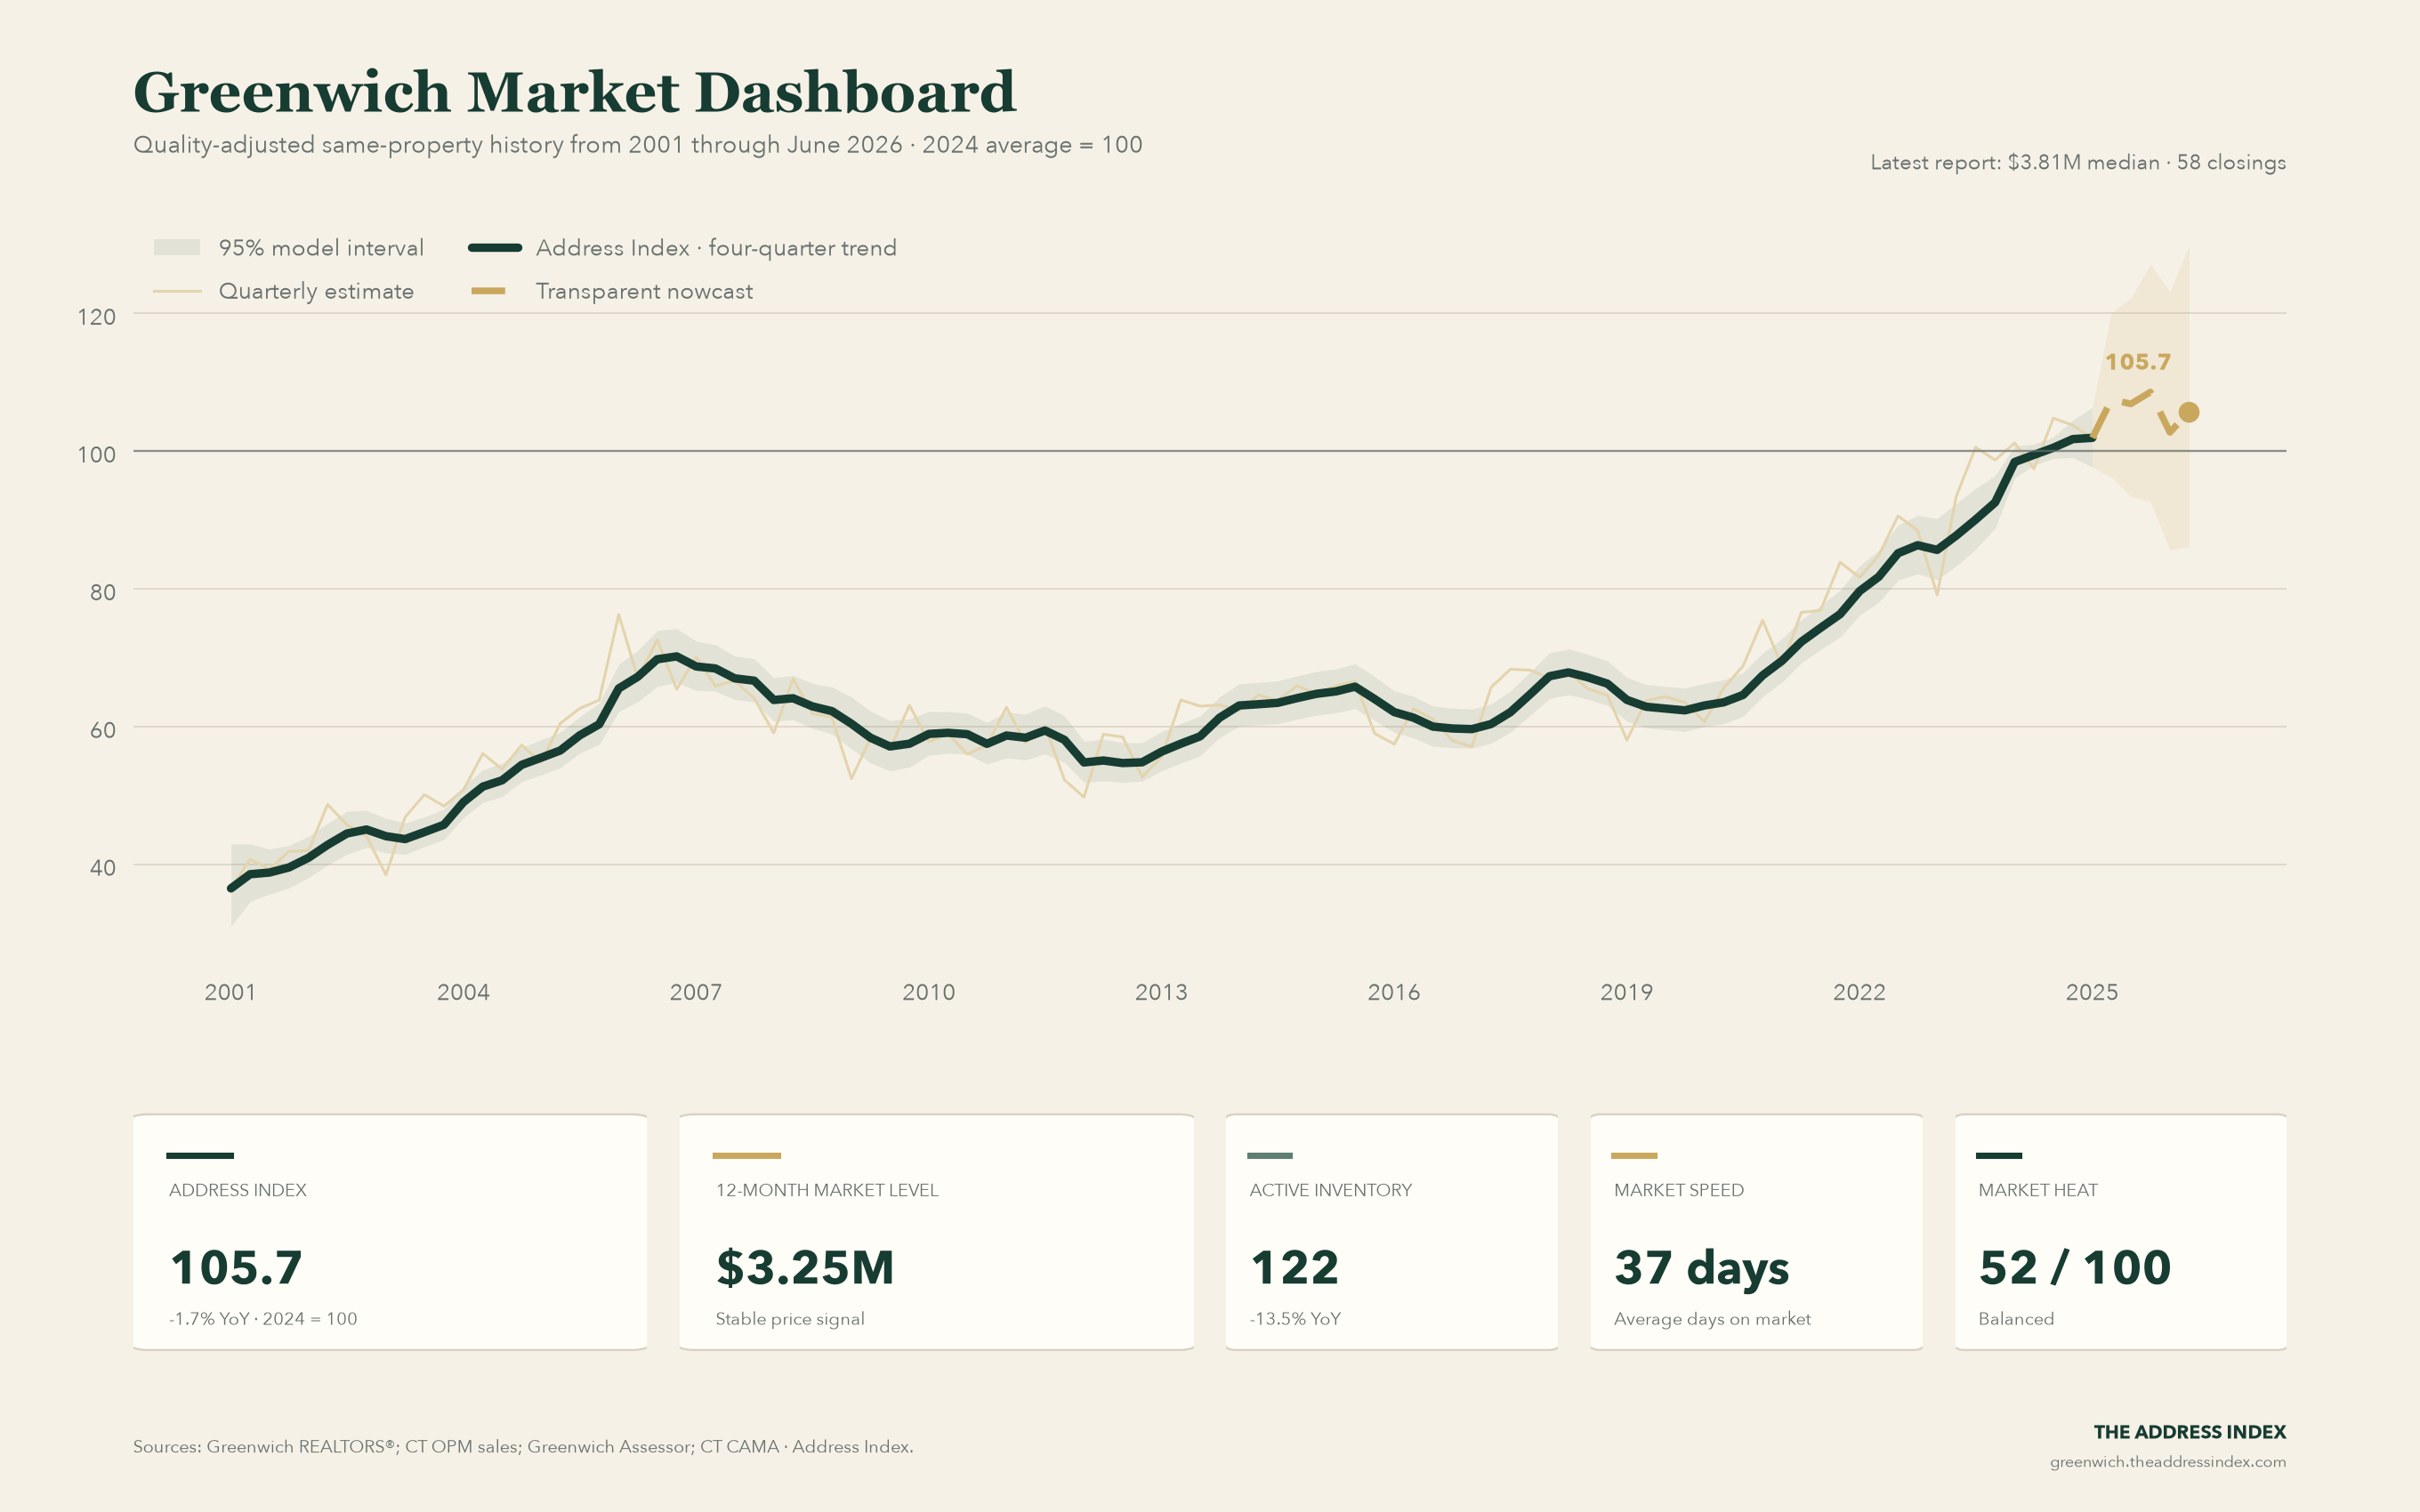
The Address Index Greenwich dashboard, through June 2026. The main chart follows quality-adjusted same-property sales from 2001; the dashed ending is a transparent nowcast after complete public transaction coverage. The separate market-level chart retains recent monthly dollar context.
Address Index: 105.7, -1.7% year over year, with 2024 = 100. The latest point is labeled nowcast.
12-month market level: $3.25M. This is the stable headline signal.
Latest reported monthly median: $3.81M. This is shown as mix-sensitive context, not as the index.
Supply and speed: 122 active single-family homes and 37 average days on market.
Market heat: 52/100 — Balanced.
View the latest underlying market report.
The Address Index reconciles 24,114 public transaction records with parcel sale histories and estimates price change from 5,136 filtered same-property pairs. Direct state transaction coverage runs through 2024 Q3; later quarters are visibly marked reconstructed or nowcast. The 12-month market level is reported separately because it remains sensitive to the mix of homes sold. Neither measure is a property appraisal.
Synthetic Twin of the Week
Explore this chart interactively →
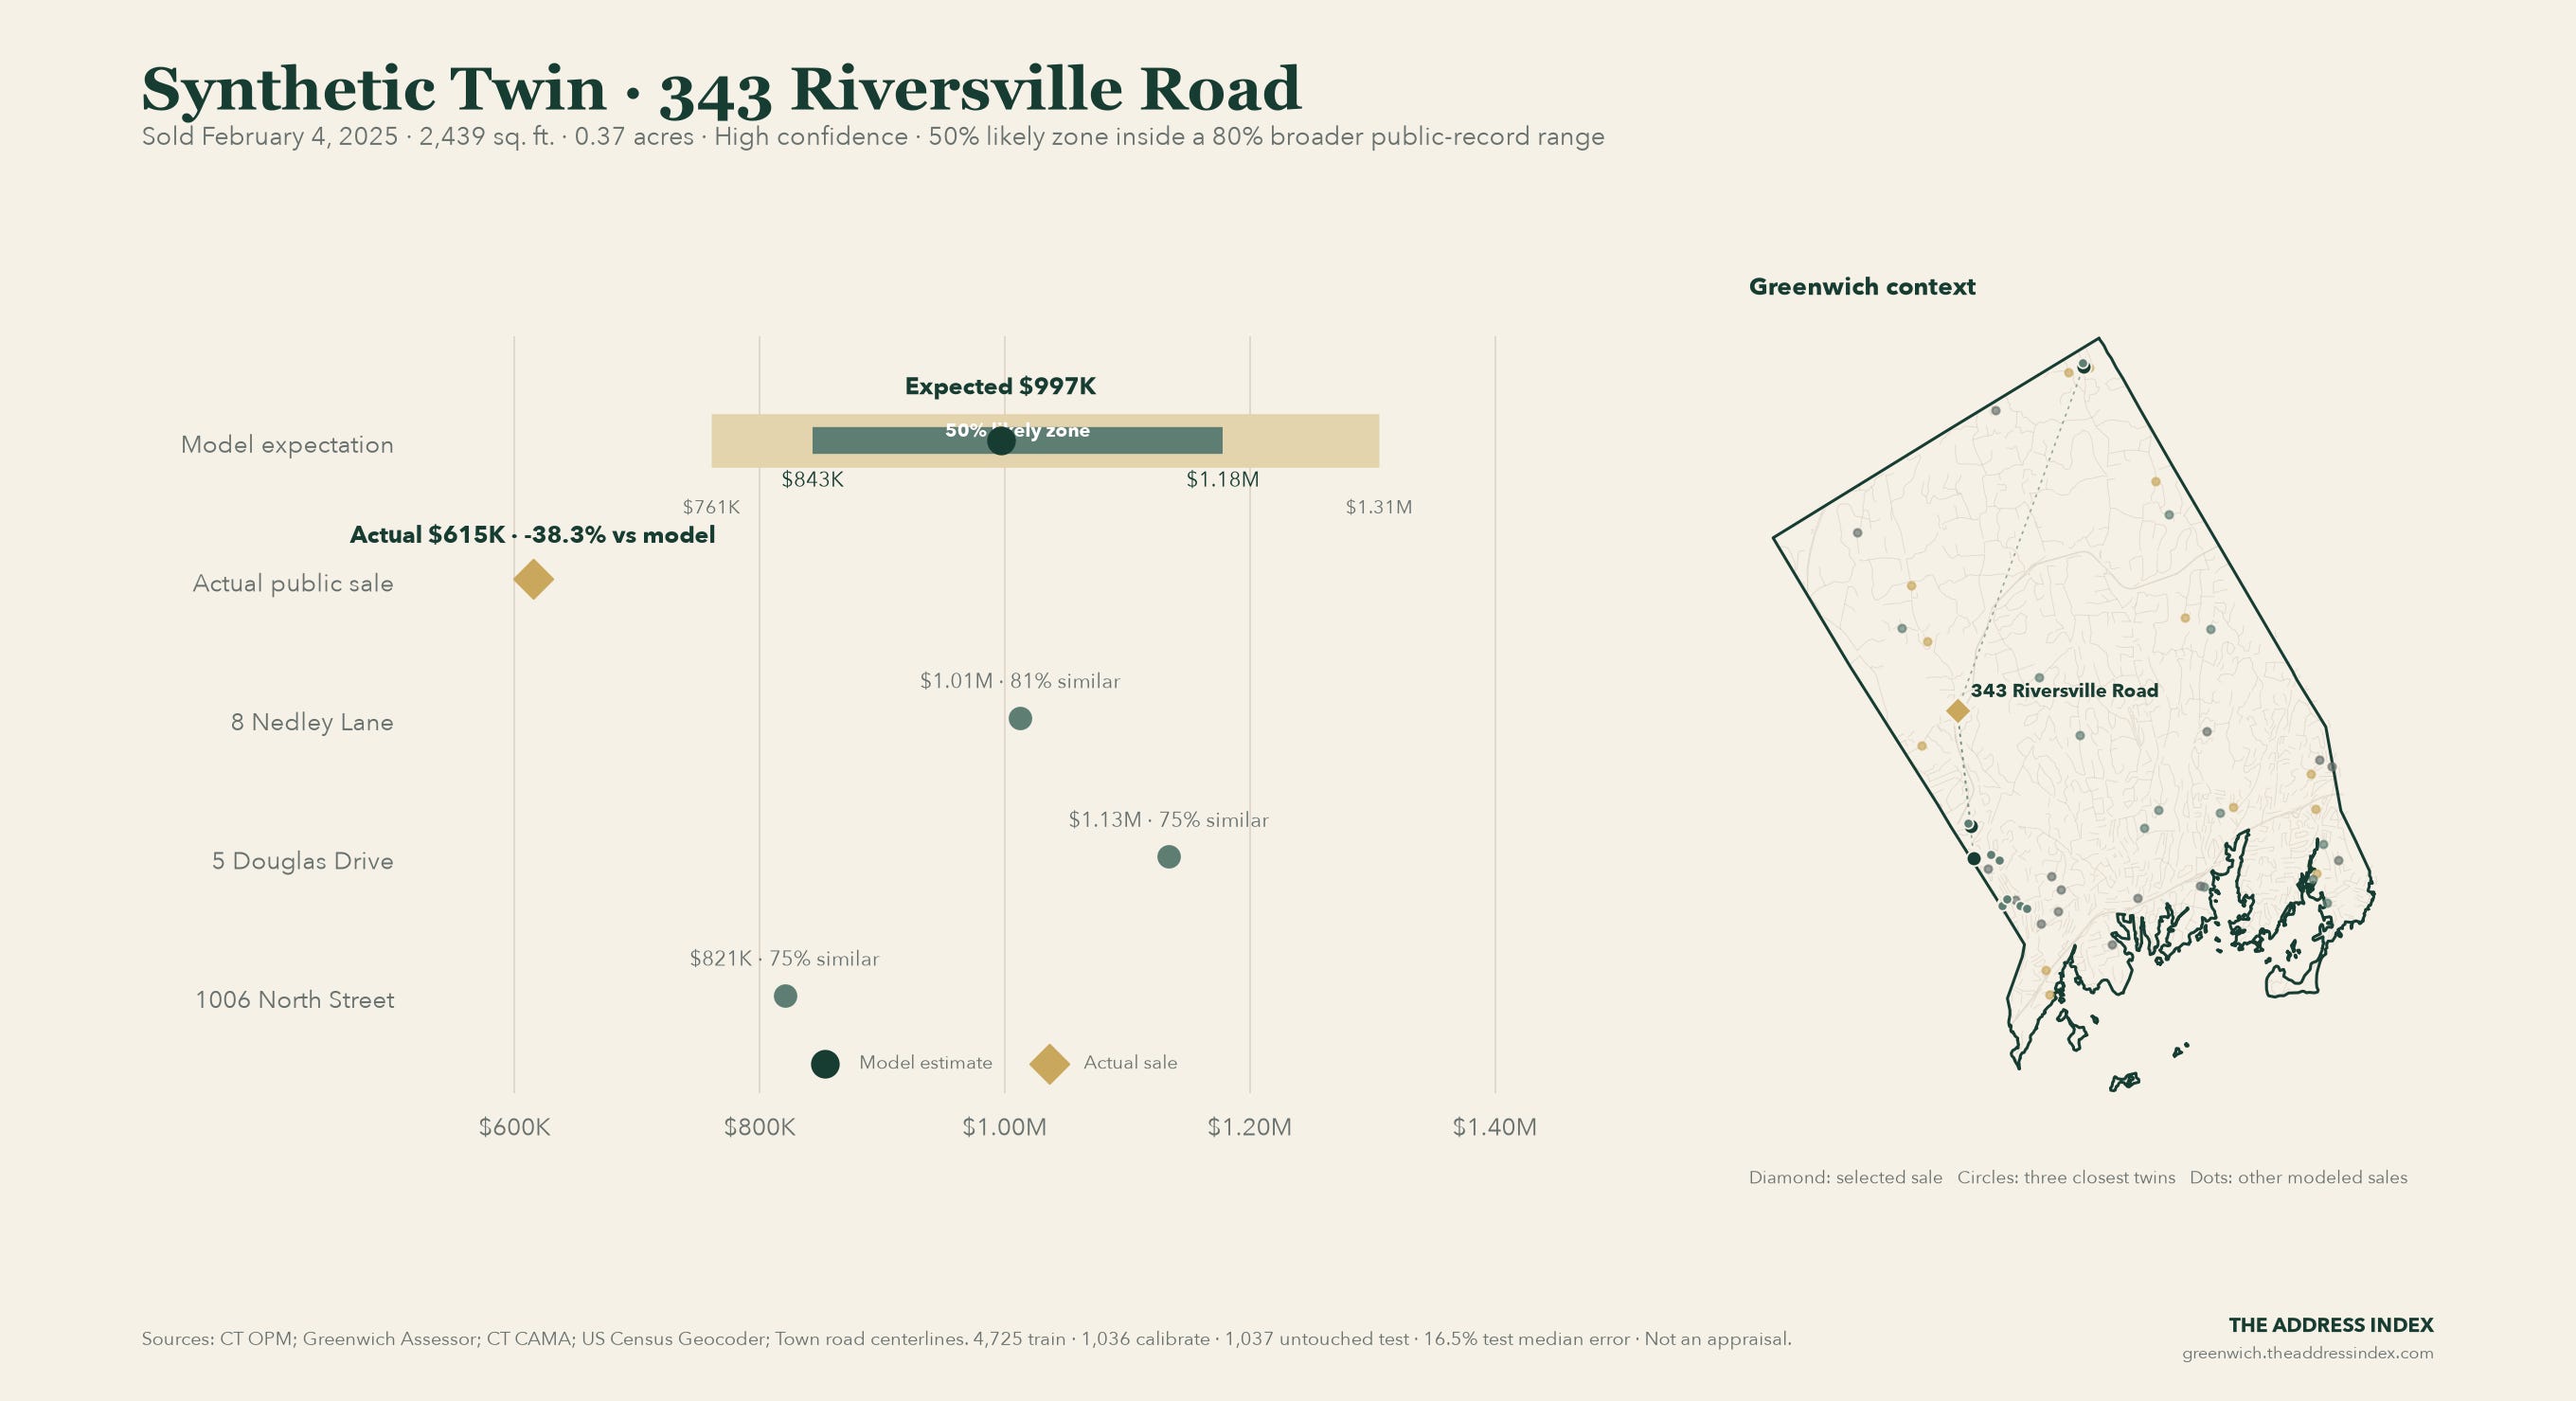
343 Riversville Road sold for $615K on February 4, 2025. That was 38.3% below the $997K model expectation and outside the 80% broader range. The tighter likely zone was $843K–$1.18M; the broader range was $761K–$1.31M.
Paid members get the adjusted earlier twins, model construction, public inputs, diagnostics, and known unknowns below.
One item to know
1. Planning and Zoning Commission Briefing Meeting
New · Planning & Zoning calendar
Agenda posted for August 3, 2026.
Why it stands out: The record scored above the publication threshold and will be tracked for later changes.
Source: Greenwich Planning & Zoning agendas.
Paid subscribers continue with the historical comparison, the full Synthetic Twin evidence, and the practical decision rule behind this week’s chart.
