
A reader asked a simple question about the Greenwich chart: why was 2024 selected as the baseline?
It is worth answering because an index can be easy to misread. The 100 line is a measuring reference—not a declaration that 2024 was a normal year, a fair-value year or the beginning of the Greenwich market.
THE SHORT ANSWER
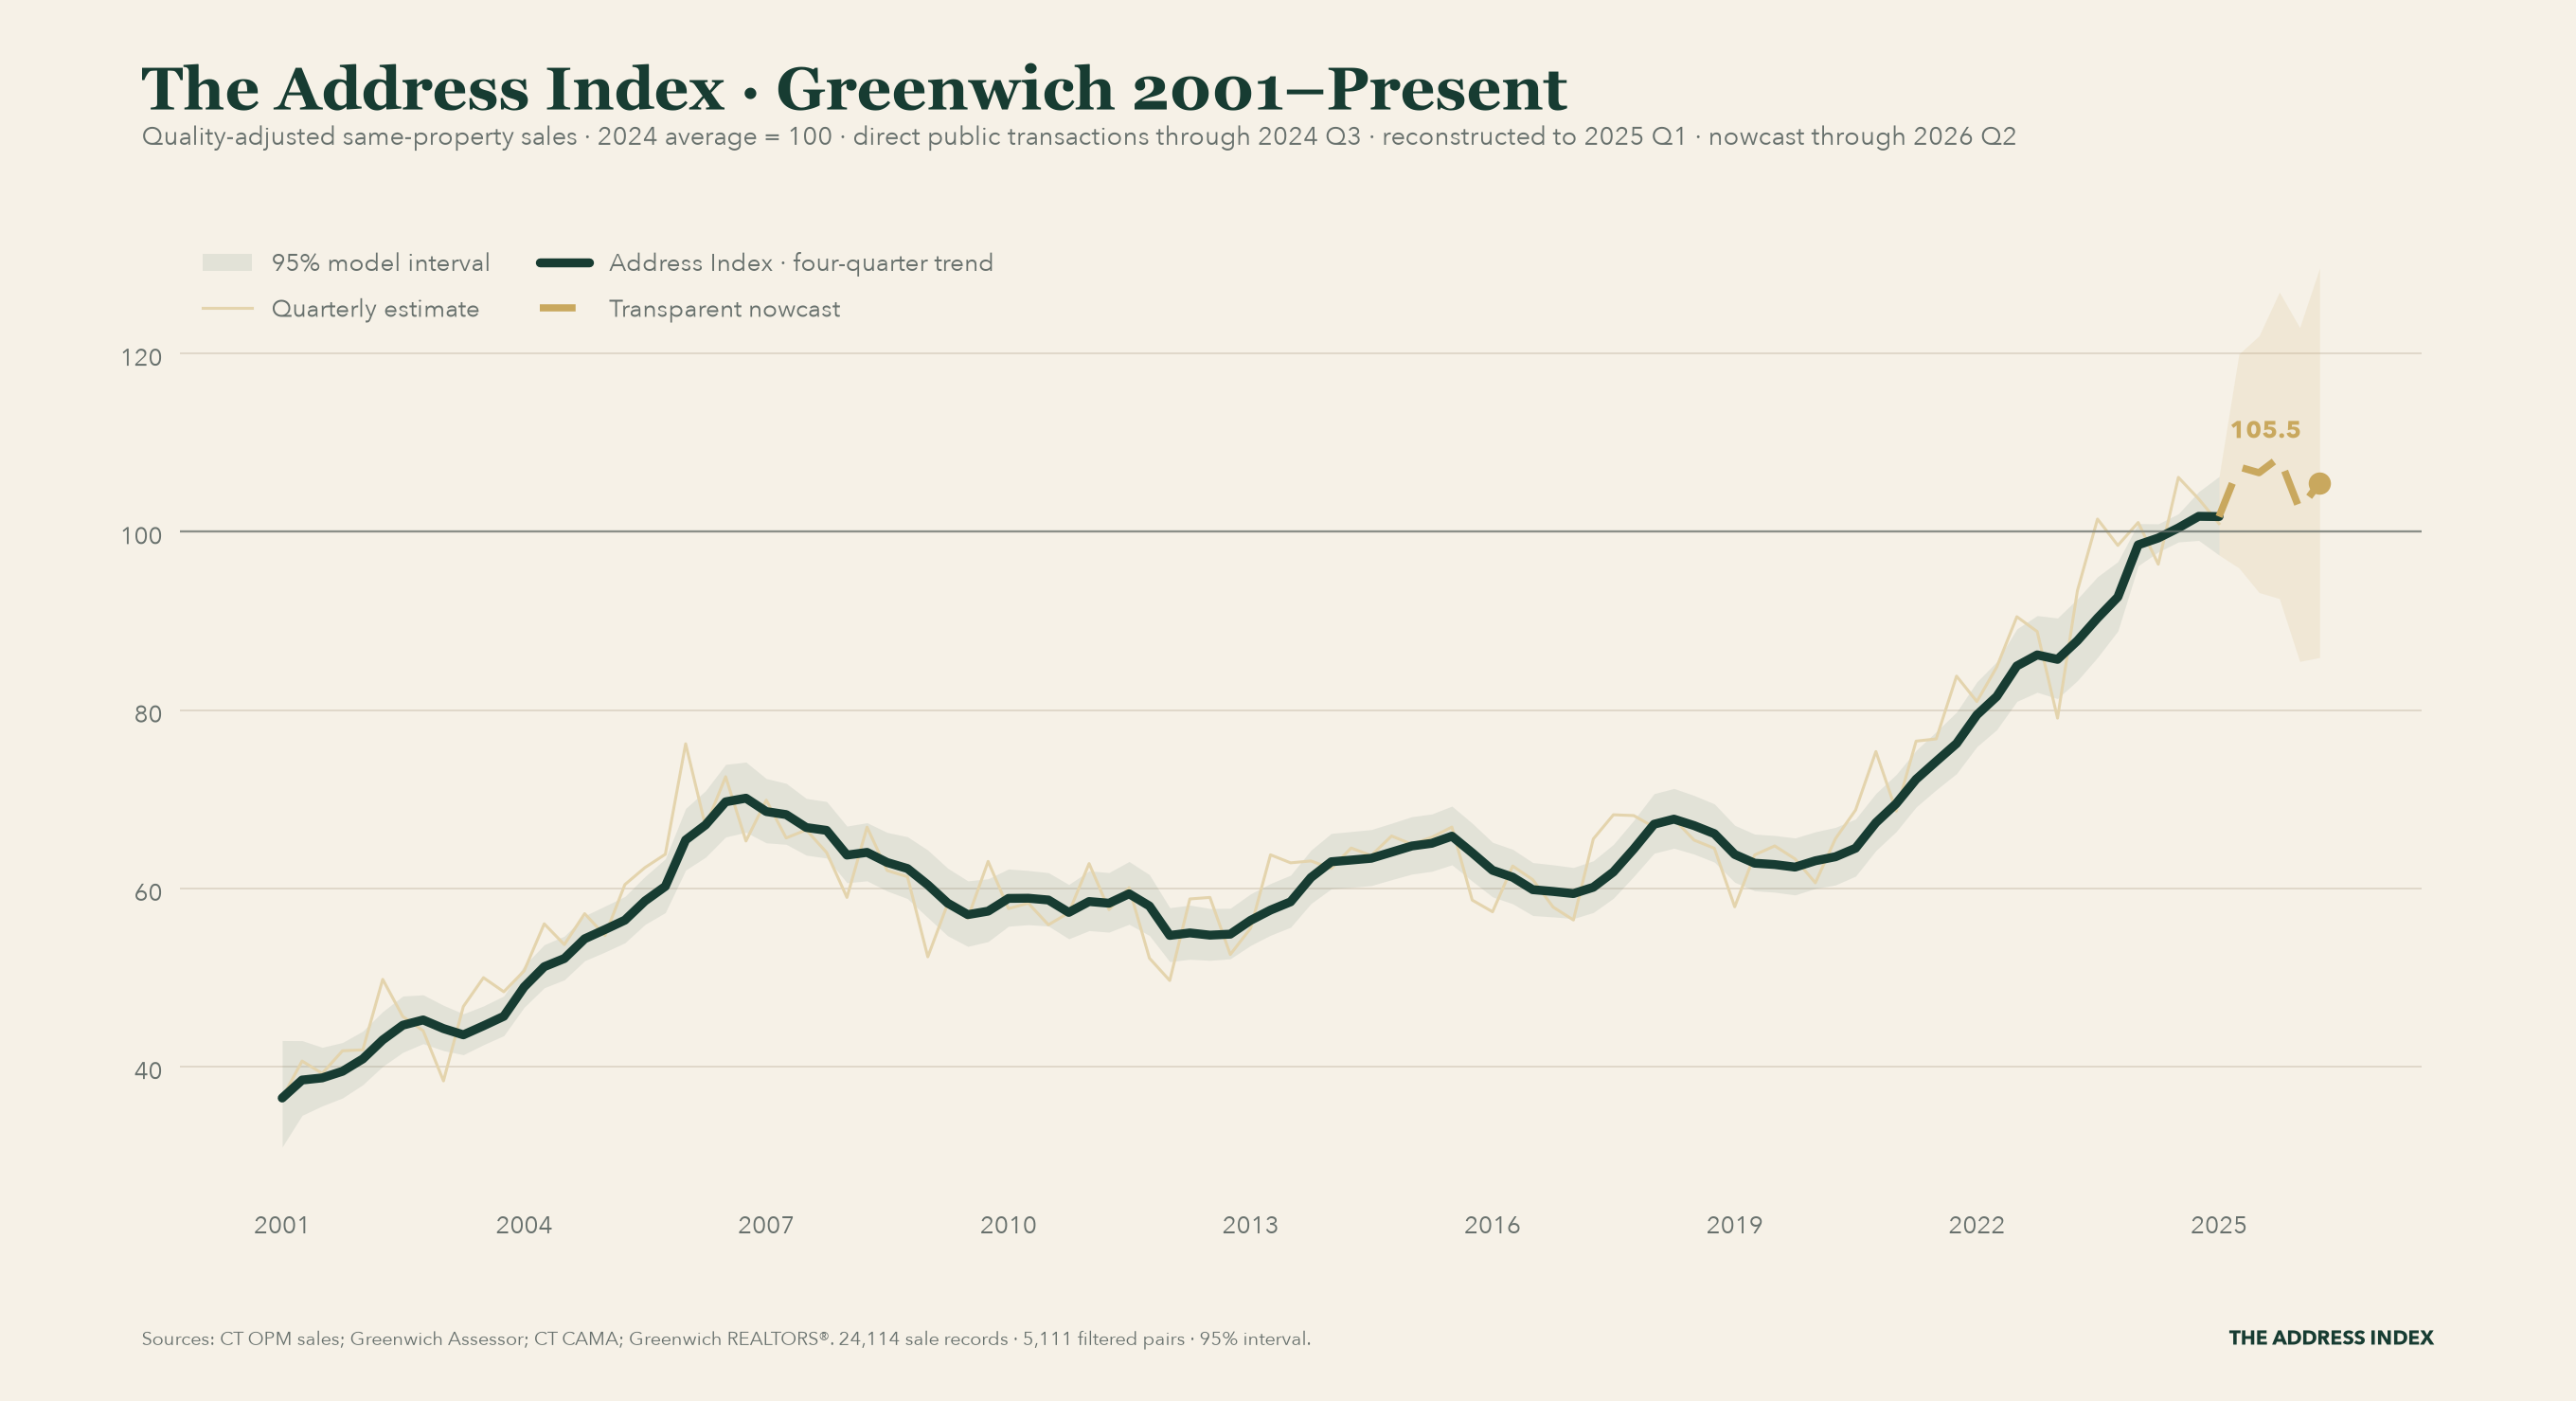
The Greenwich Address Index is set so that the average level during 2024 equals 100. The latest reading of 105.5 therefore means the quality-adjusted market level is approximately 5.5% above the 2024 average.
It does not mean the typical Greenwich home costs $105.50. It is not a score out of 100. And it does not mean every home has gained 5.5% since January 1, 2024.
WHY USE 2024?
An index needs a reference period so its values are easy to read. We chose 2024 because it is recent and familiar, and it keeps current readings near 100 rather than producing an arbitrary-looking number such as 263.7.
We did not choose 2024 because we believe it represents a perfectly balanced or historically normal market. It is simply the ruler.
The index could instead be set so that 2019, 2010 or 2001 equaled 100. Every displayed level would change, but the underlying market history would not. The decline after the mid-2000s peak, the post-2020 rise, the turning points and the year-over-year changes would all remain identical.
Renumbering the mile markers does not change the road.
HOW TO READ THE CHART
The horizontal 100 line represents the average quality-adjusted market level during 2024.
The dark green line is the four-quarter trend derived from same-property sales. The lighter quarterly line shows more of the short-term movement. The shaded area represents model uncertainty. The dashed gold ending is the transparent nowcast used while complete public transaction records catch up.
The latest reading is 105.5. That is 5.5% above the 2024 average, but 1.7% below the comparable level a year earlier. Those statements can both be true: Greenwich remains above its 2024 reference level while recent momentum has softened.
WHAT THE INDEX ADDS
Greenwich’s reported June median sale price was $3.81 million. That is useful, but a monthly median can rise simply because more expensive homes happened to close.
The Address Index asks a different question: after accounting for the properties that sold, how did the underlying market level move?
To answer it, the current Greenwich model reconciles 24,114 public transaction records and estimates price change from 5,111 filtered same-property sale pairs. The index is therefore designed to reduce the effect of a changing mix of homes—not to estimate the value of every individual property.
We report the stable 12-month dollar market level separately, currently approximately $3.25 million, because readers also need an intuitive dollar reference. The index and the dollar level answer related but different questions.
WHAT REBASING WOULD—AND WOULD NOT—CHANGE
Changing the baseline would change:
• The number printed beside every point.
• The location of the 100 line.
Changing the baseline would not change:
• The percentage gain or decline between two periods.
• Whether the market was rising or falling.
• The timing of peaks and troughs.
• The current 1.7% year-over-year change.
That is why 2024 is not a hidden assumption about value. It is a presentation choice that makes the chart easier to understand.
THE BOTTOM LINE
Read 105.5 as: the quality-adjusted Greenwich market level is about 5.5% above its average 2024 level. Then look separately at momentum—the current reading is 1.7% below a year ago—and at the uncertainty around the latest nowcast.
The interactive chart lets you inspect every period from 2001 onward:
https://greenwich.theaddressindex.com/market/greenwich-home-price-index?utm_source=substack&utm_medium=post&utm_campaign=sunday_index_baseline
Forwarded this briefing? Subscribe free to receive the next Greenwich update:

METHOD
The Address Index is a quality-adjusted repeat-sales measure built from public transaction and parcel records. Direct state transaction coverage currently runs through 2024 Q3; later periods are visibly marked reconstructed or nowcast. It is a market indicator, not an appraisal or a prediction for an individual property.