
A note to readers: We missed several weekly editions. We’re sorry for the gap, and we appreciate your patience.
The August picture
Greenwich ended August with 83 single-family homes for sale, down from 113 in July. Homes that closed averaged 17 days on market, compared with 36 in July. Those are the clearest changes in the latest Greenwich Realtors report.
The result is an uncomfortable combination for buyers: less choice and less time to evaluate the homes that attract demand. For sellers, it is a reason to study the competition carefully before choosing an asking price.
Three other figures complete the picture:
37 closings, versus 58 in August last year.
17 new listings, versus 26 a year earlier.
$3.95 million median sale price, up from $2.80 million a year earlier.
That last number needs care. A higher monthly median can reflect a different collection of homes selling. It does not establish that the same Greenwich house gained 41% in value.
The speed figure also describes homes that sold. It does not tell us how long the remaining inventory has been sitting, or promise a 17-day sale for a new listing. And these are August observations, not a live September inventory count.
How much choice does 83 homes represent?
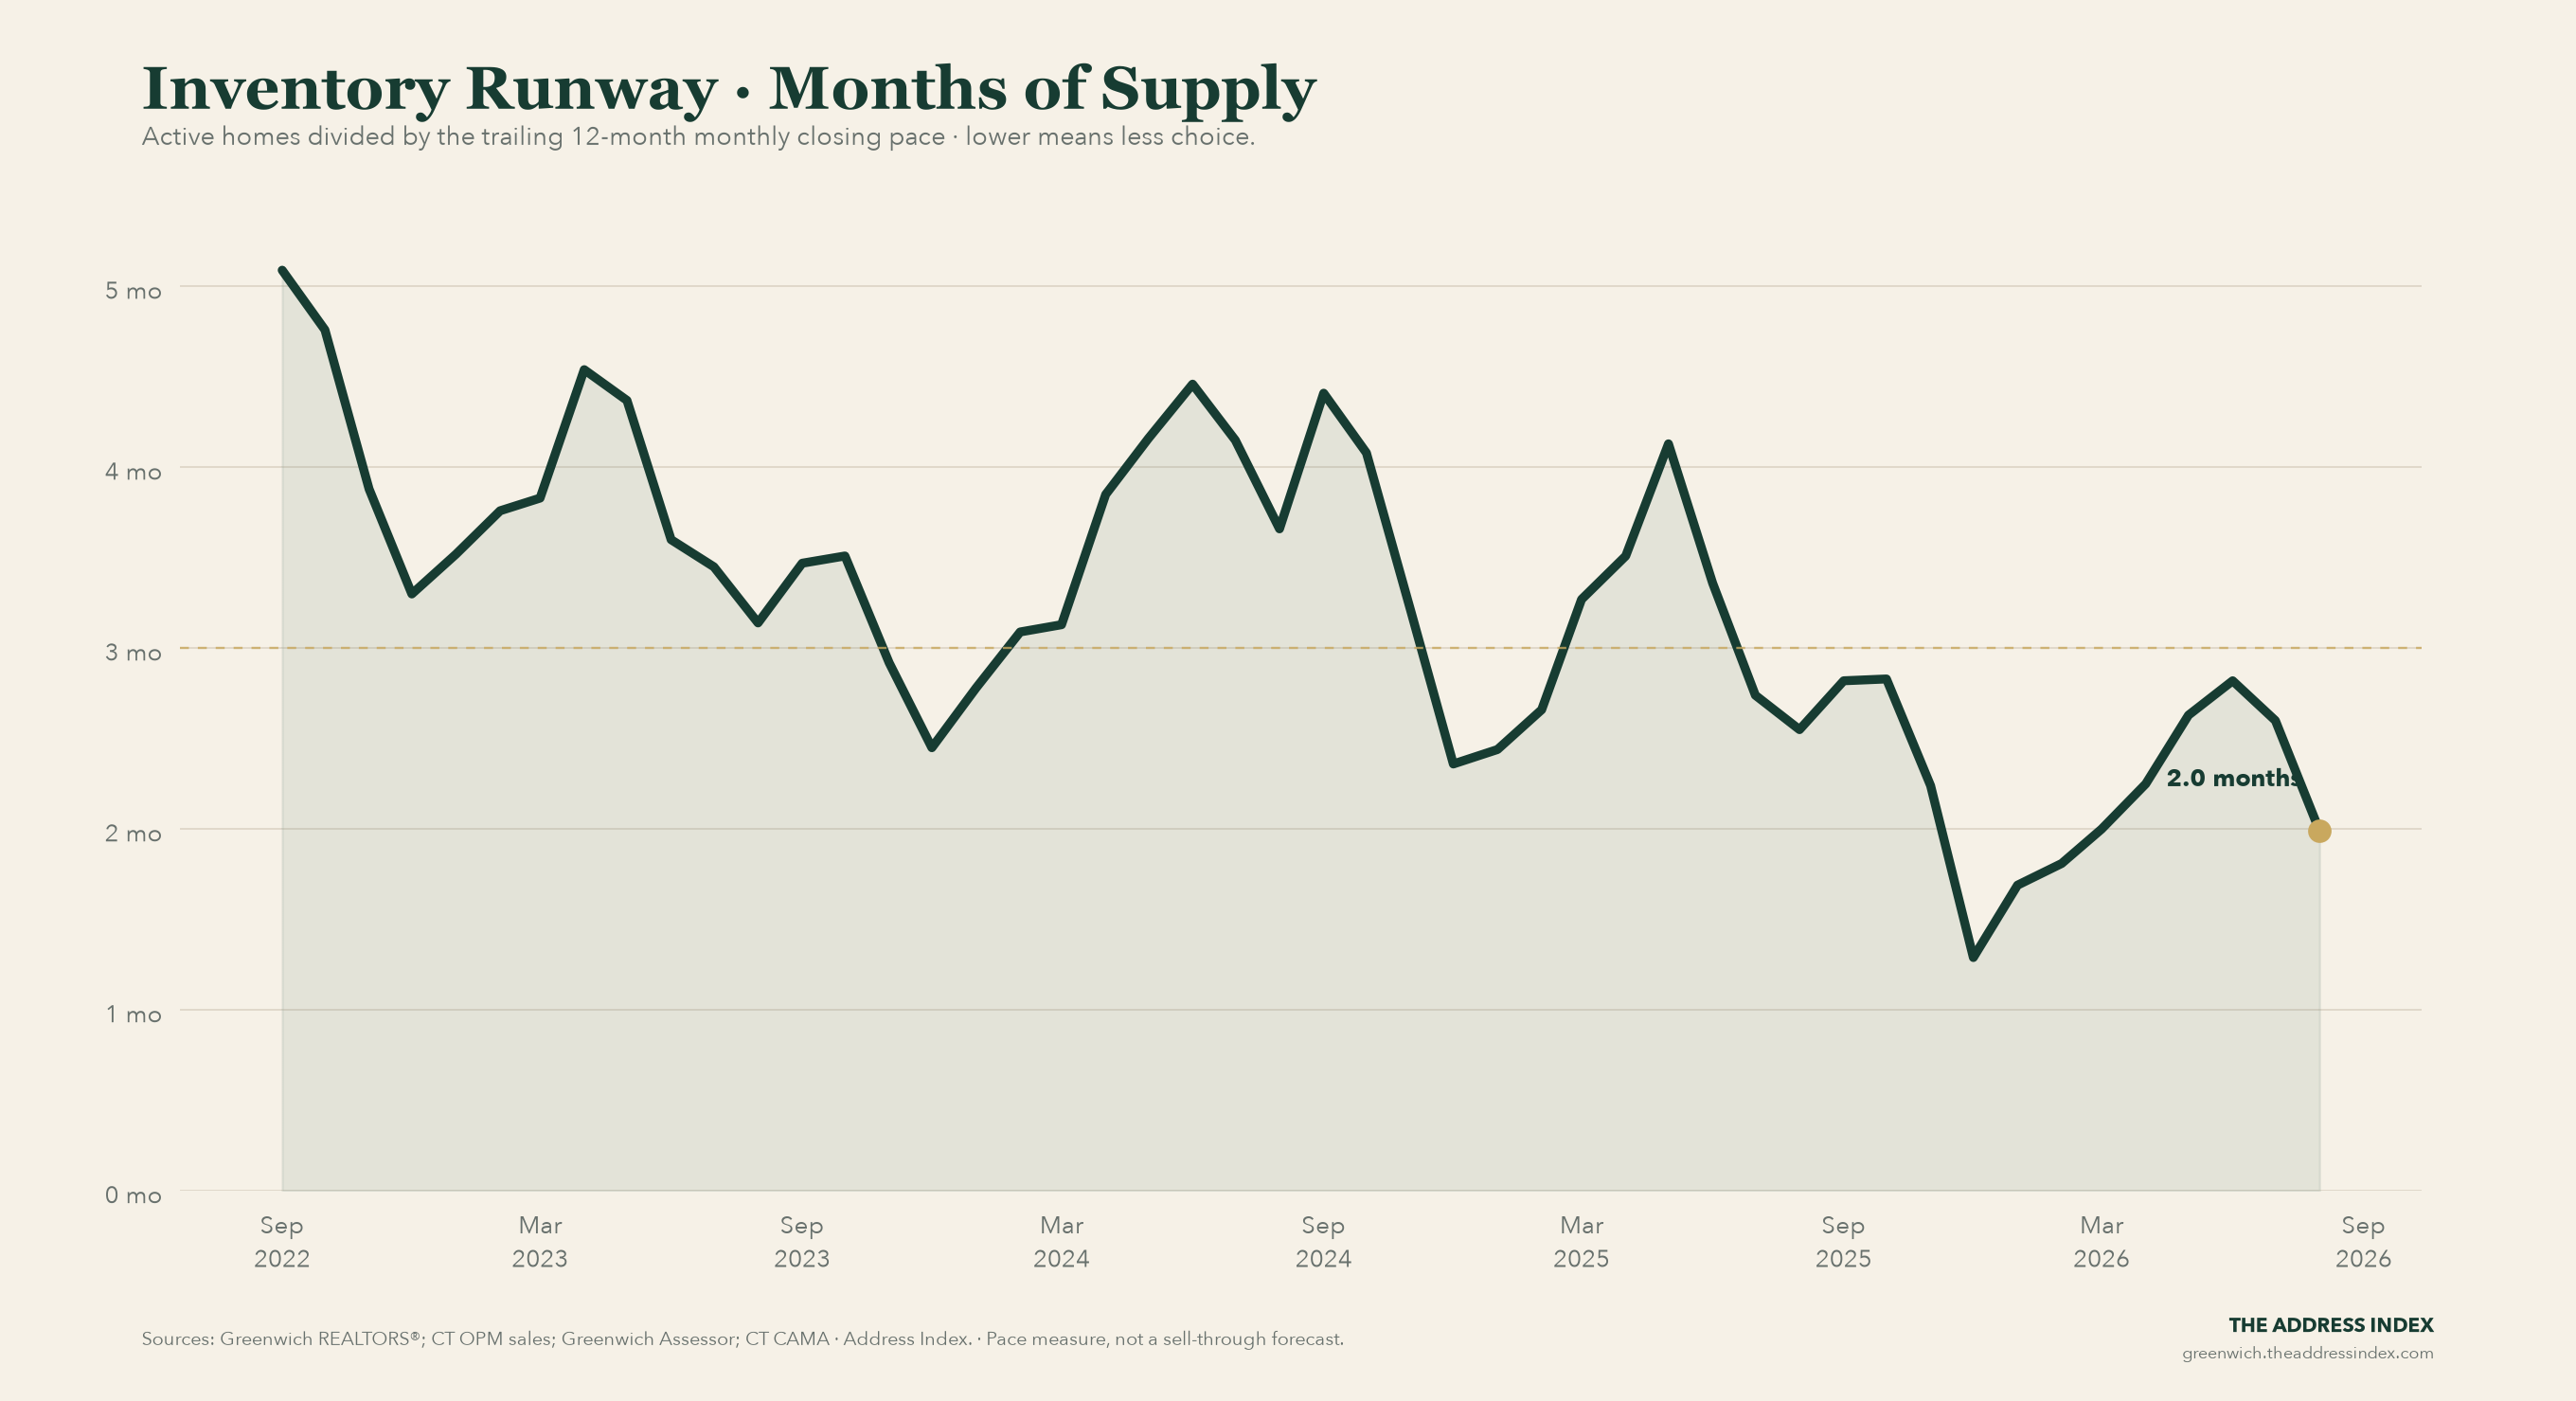
Our inventory-runway measure puts that stock at 2.0 months of supply, using the preceding year’s average closing pace. It is a way to compare the size of the shelf with the rate of sales; new listings, withdrawals, and changes in demand will keep moving both sides of the calculation.
Explore the inventory history and sources →
Our reading: August gives buyers little reason to assume that a fall in transactions has created broad negotiating power. The useful next question is how scarce the alternatives are for the particular home under consideration.
Below: why our leverage gauge still reads “balanced,” what the price jump can and cannot tell us, and a practical checklist for the next property decision.
