
Are Greenwich listings really taking longer to sell this summer?
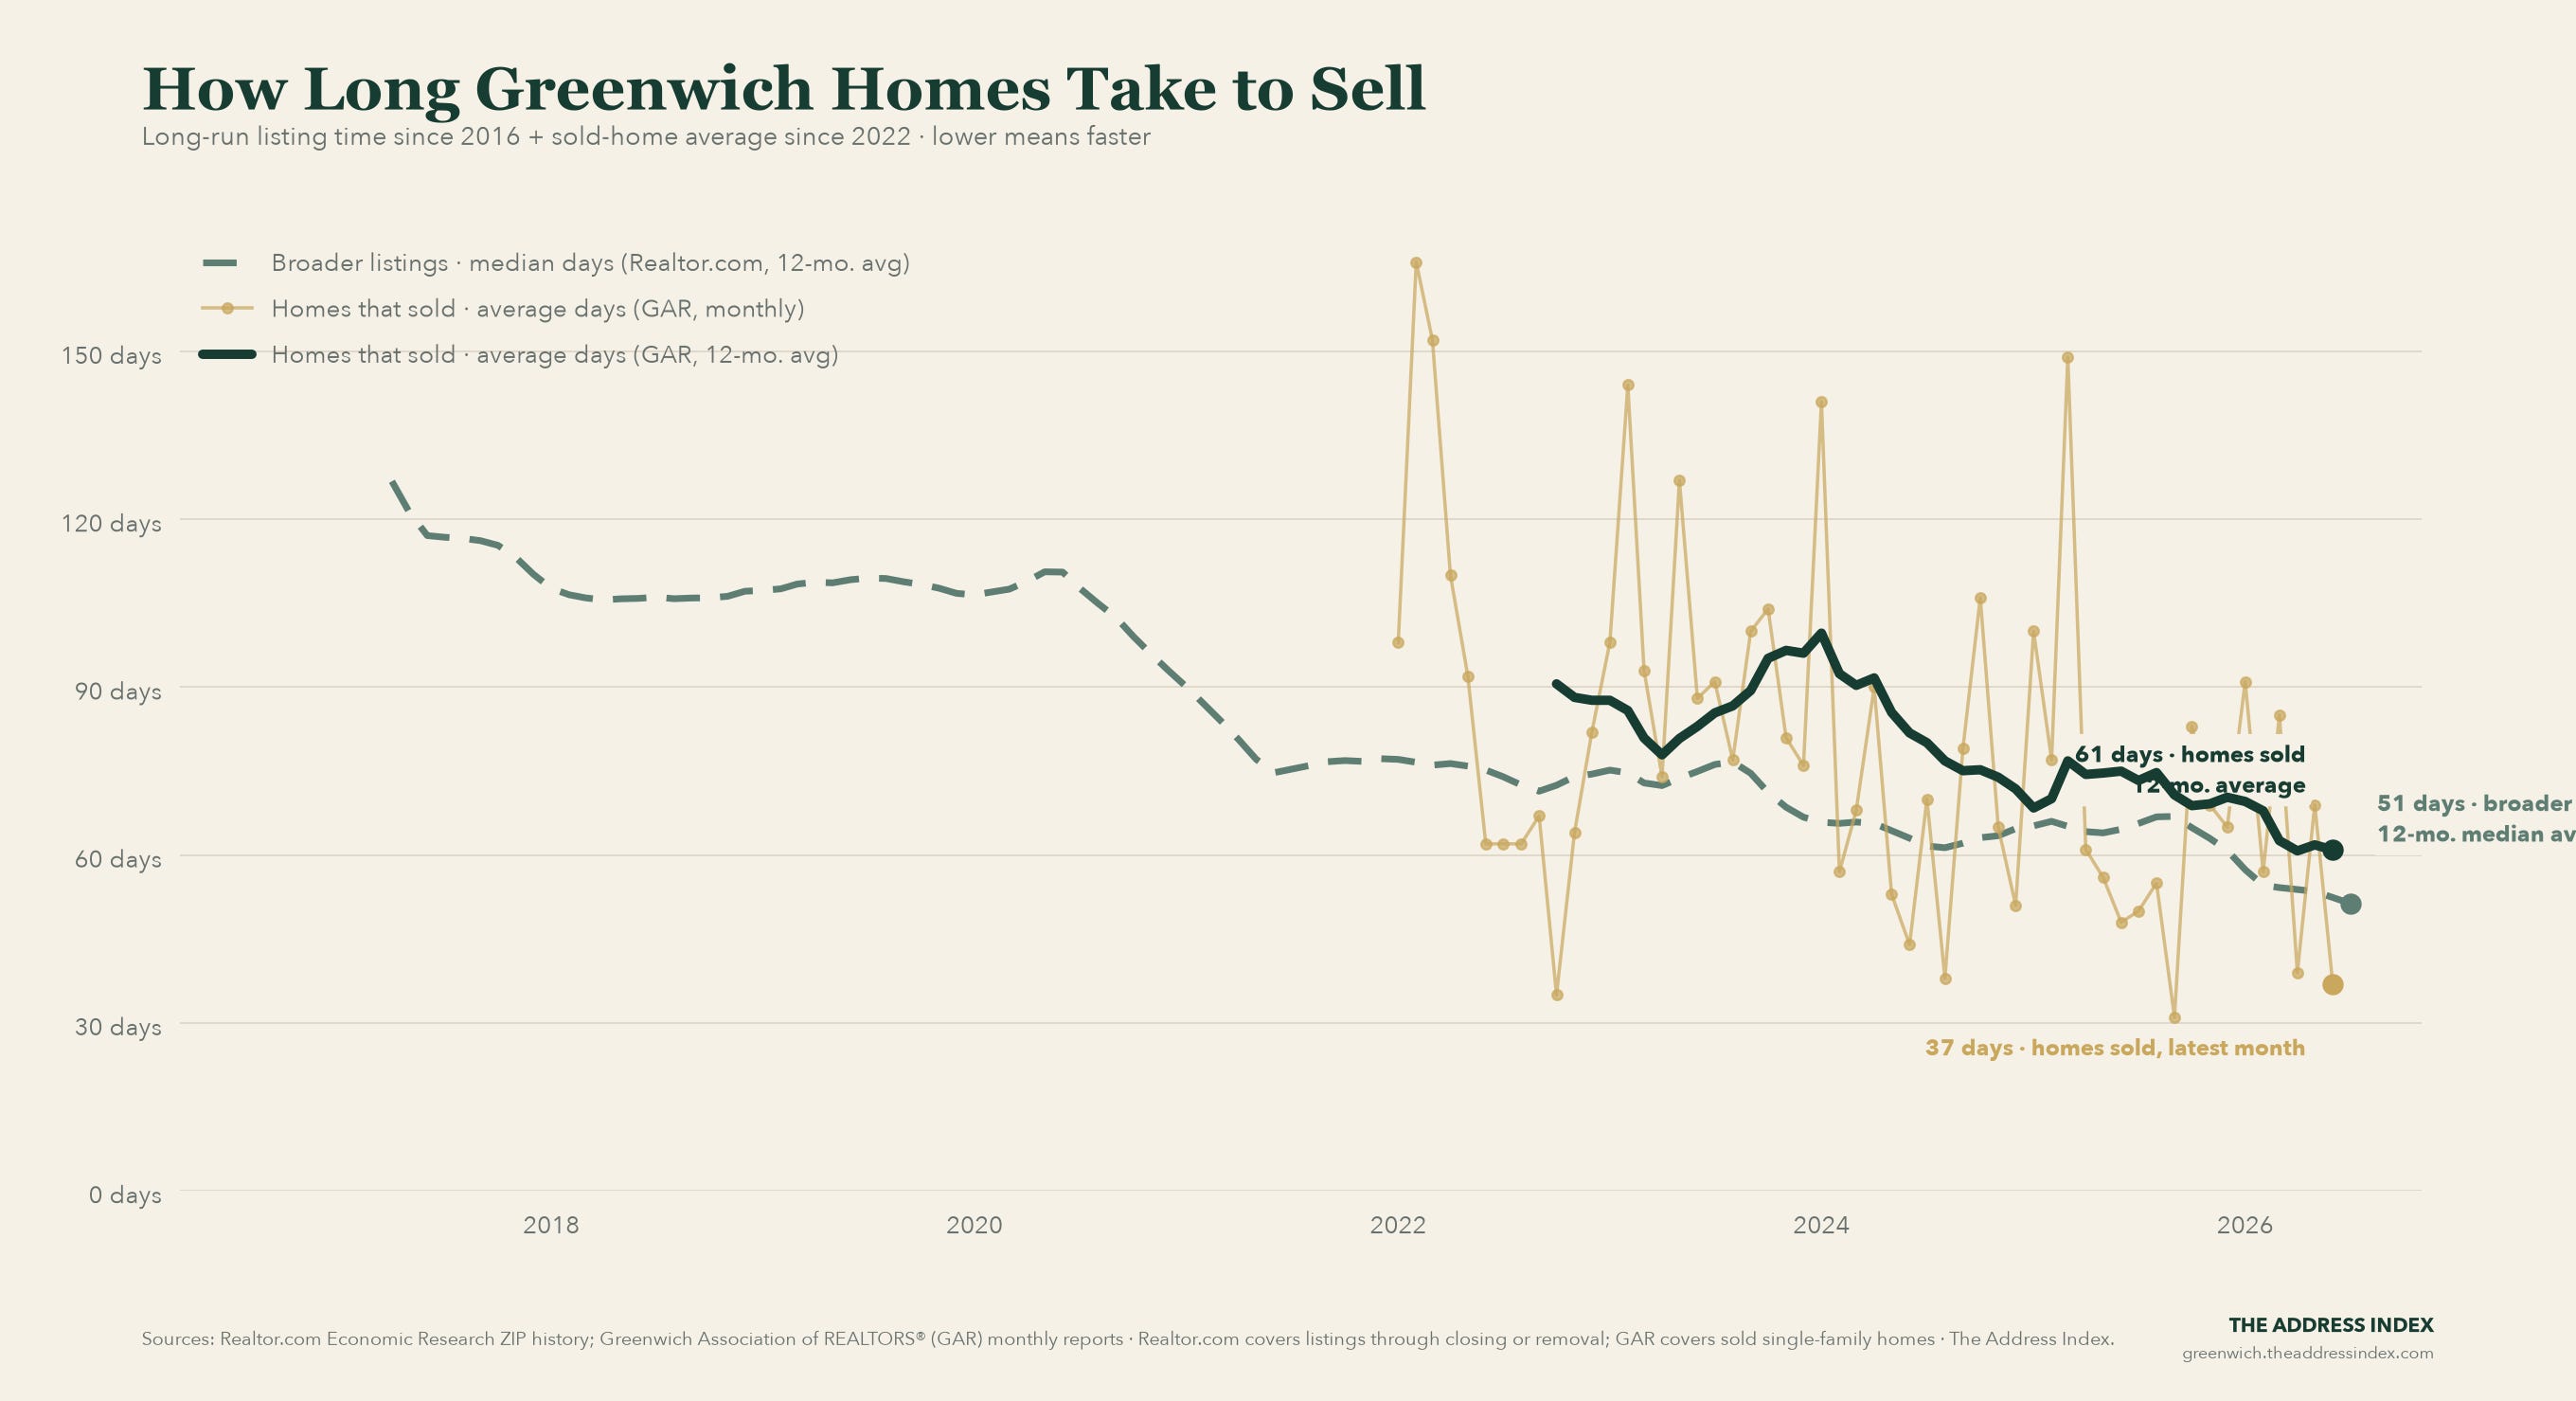
The broader Greenwich ZIP composite averaged 51.4 median listing days over the 12 months through July 2026, versus 65.7 days in the preceding 12 months. July itself measured 49.7 days. Greenwich Realtors separately reported 37 average days for homes sold in June 2026; the two series measure different populations.
For buyers: Summer listings are taking longer than they did in spring, but the seasonally steadier comparison remains faster than a year ago.
For sellers: A summer month-to-month slowdown is not the same as a broken market; compare with the same season and price band before reacting.
For brokers and advisers: Keep median listing time separate from average days for homes that sold, and use the trailing line when discussing the underlying trend.
Chart of the week
Explore this chart interactively →
How Long Greenwich Homes Take to Sell. Greenwich single-family homes averaged 37 days on market in June 2026, versus 48 a year earlier. The trailing 12-month average was 61 days. A separate Realtor.com ZIP composite extends the directional history to July 2016; it measures median listing time, not GAR’s average for sold homes. Its latest 12-month average was 51 days, versus 66 a year earlier.
This is the week’s main finding. Open the interactive version to inspect the full history and its source notes.
The public-record tape
This week’s official-source sweep found 8 planning applications above our publication threshold.
The source links below are the record. Verify any item before relying on it.
Greenwich market dashboard
Explore this chart interactively →
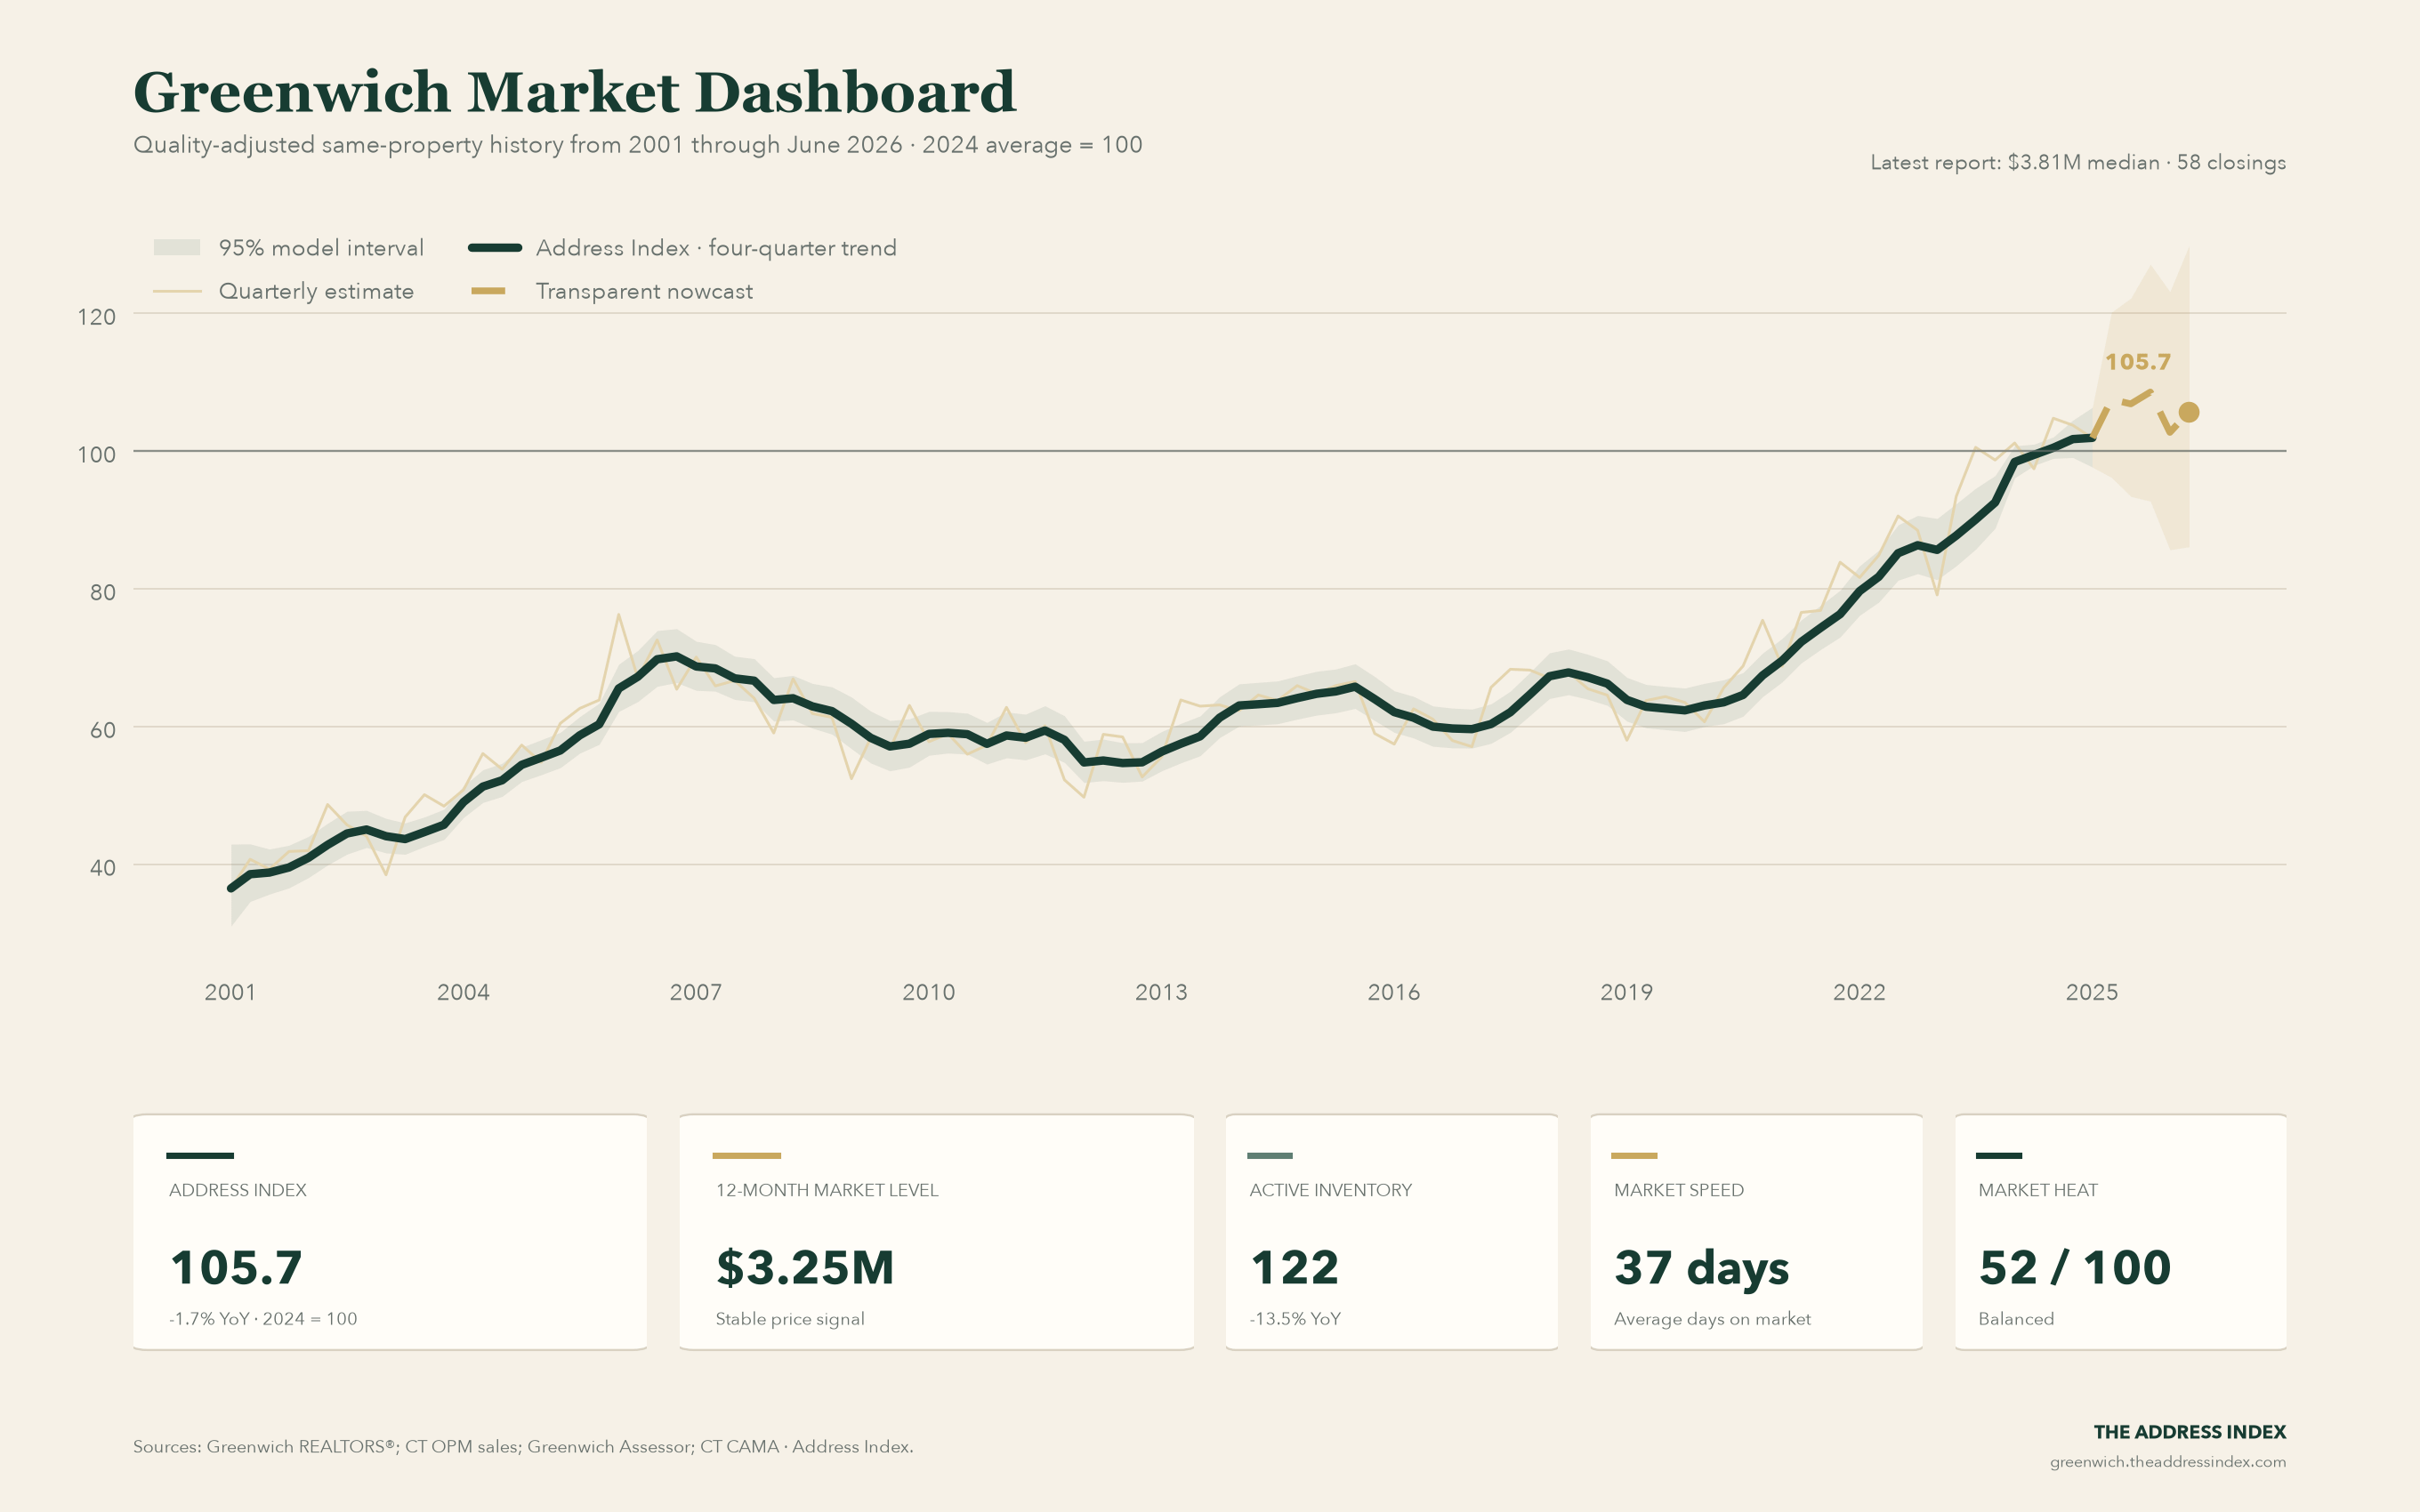
The Address Index Greenwich dashboard, through June 2026. The main chart follows quality-adjusted same-property sales from 2001; the dashed ending is a transparent nowcast after complete public transaction coverage. The separate market-level chart retains recent monthly dollar context.
Address Index: 105.7, -1.7% year over year, with 2024 = 100. The latest point is labeled nowcast.
12-month market level: $3.25M. This is the stable headline signal.
Latest reported monthly median: $3.81M. This is shown as mix-sensitive context, not as the index.
Supply and speed: 122 active single-family homes and 37 average days on market.
Market heat: 52/100 — Balanced.
View the latest underlying market report.
The Address Index reconciles 24,114 public transaction records with parcel sale histories and estimates price change from 5,136 filtered same-property pairs. Direct state transaction coverage runs through 2024 Q3; later quarters are visibly marked reconstructed or nowcast. The 12-month market level is reported separately because it remains sensitive to the mix of homes sold. Neither measure is a property appraisal.
Synthetic Twin of the Week
Explore this chart interactively →
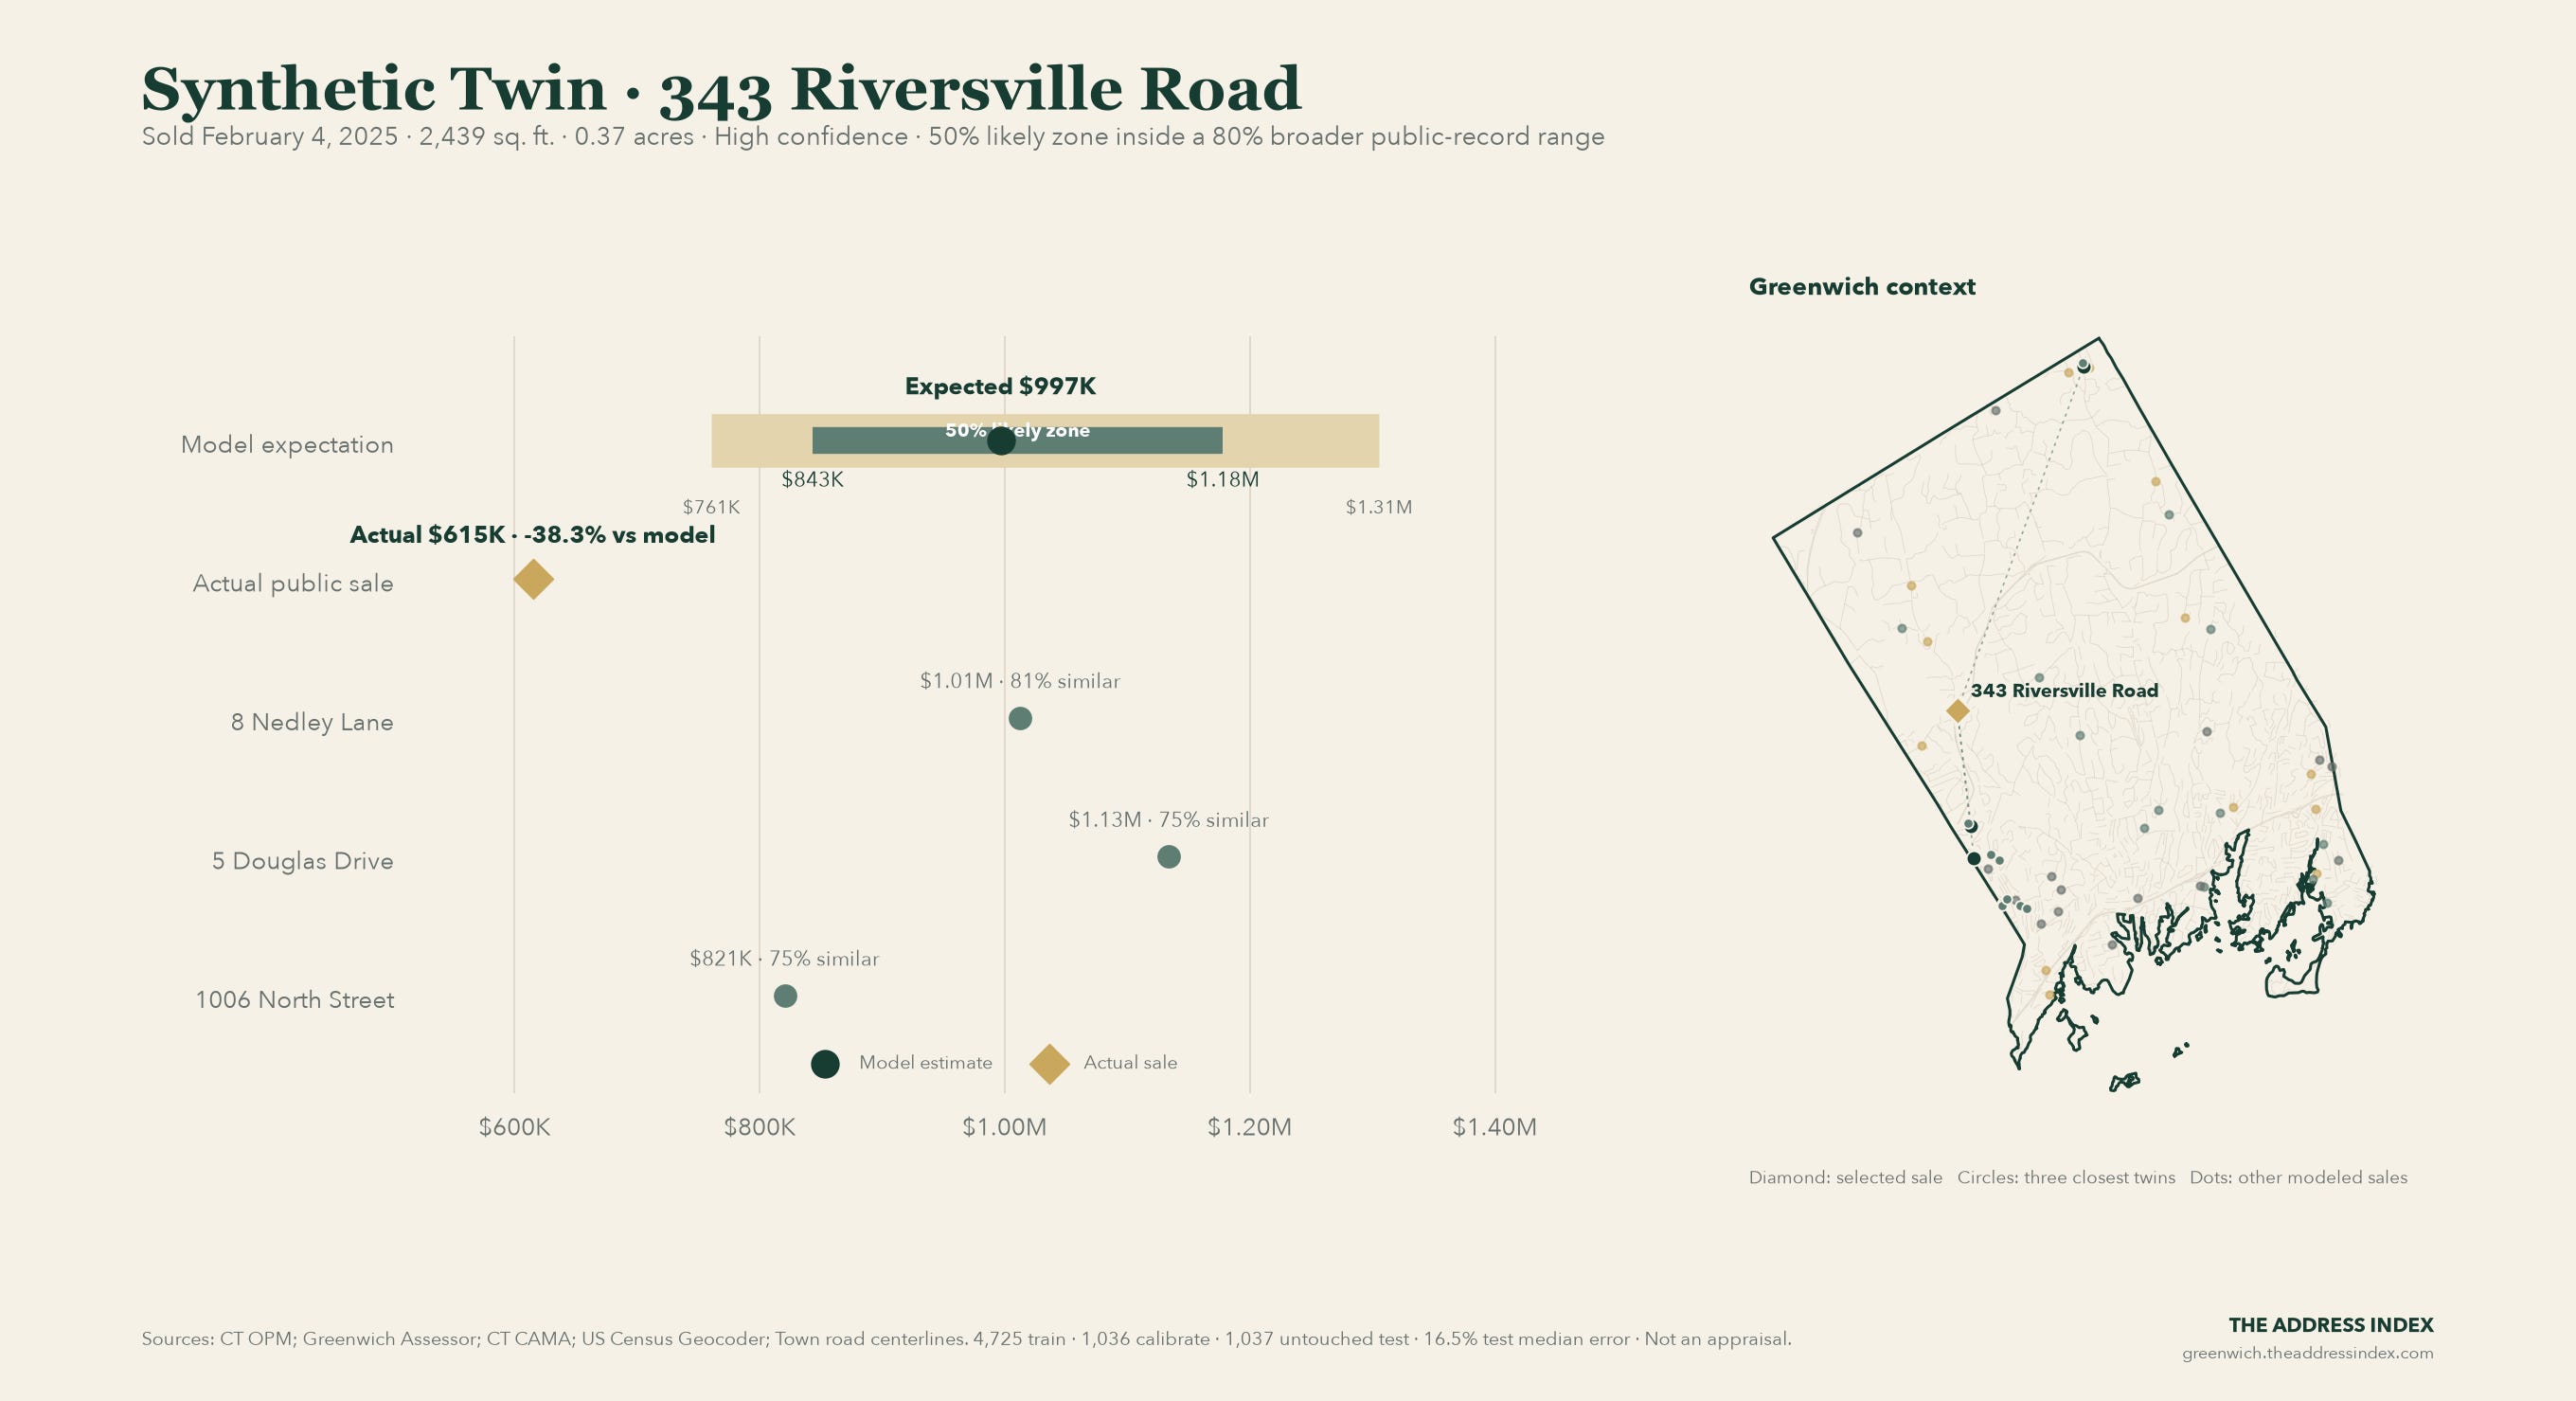
343 Riversville Road sold for $615K on February 4, 2025. That was 38.3% below the $997K model expectation and outside the 80% broader range. The tighter likely zone was $843K–$1.18M; the broader range was $761K–$1.31M.
Paid members get the adjusted earlier twins, model construction, public inputs, diagnostics, and known unknowns below.
Three items to know
1. PLPZ202600115: 241 Hamilton Avenue
No longer listed · Planning applications
Set aside one residential unit in a 3-unit dwelling under 8-30g and make site improvements, expanding parking
Why it stands out: The proposed unit count and affordability component make this a notable density and land-use matter.
Property baseline: Three Family; assessed at $635,110; 0.17 acres; 4,232 square feet; last reported sale $925,000 on October 20, 2020.
Source: Greenwich pending planning applications.
2. PLPZ202600266: 1205 East Putnam Avenue
No longer listed · Planning applications
Pre-Application Review for proposed demolition of an existing 2-family home and two-car garage and reconstruction of 2-three 1/2 story buildings, 33 parking spaces with 1 ADA space, Bldg A = 6 town houses, Bldg B =7 town houses. 15.38%, or two units, will qualify as Moderate Housing under Sec. 6-110
Why it stands out: A demolition-and-rebuild proposal represents a material potential change to the site, which is why it clears the weekly significance threshold.
Property baseline: Two Family; assessed at $681,450; 0.65 acres; 1,491 square feet.
Source: Greenwich pending planning applications.
3. PLPZ202600229: 29 Doubling Road
No longer listed · Planning applications
Oversized residence
Why it stands out: The proposed scale is the reason this filing stands out from routine property work.
Property baseline: Single Family; assessed at $5,071,570; 2.80 acres; 9,026 square feet; last reported sale $6,100,000 on December 8, 2020.
Source: Greenwich pending planning applications.
Paid subscribers continue with the historical comparison, the full Synthetic Twin evidence, and the practical decision rule behind this week’s chart.