
Public-record activity observed July 16–July 23, 2026.
How much choice do Greenwich buyers actually have?
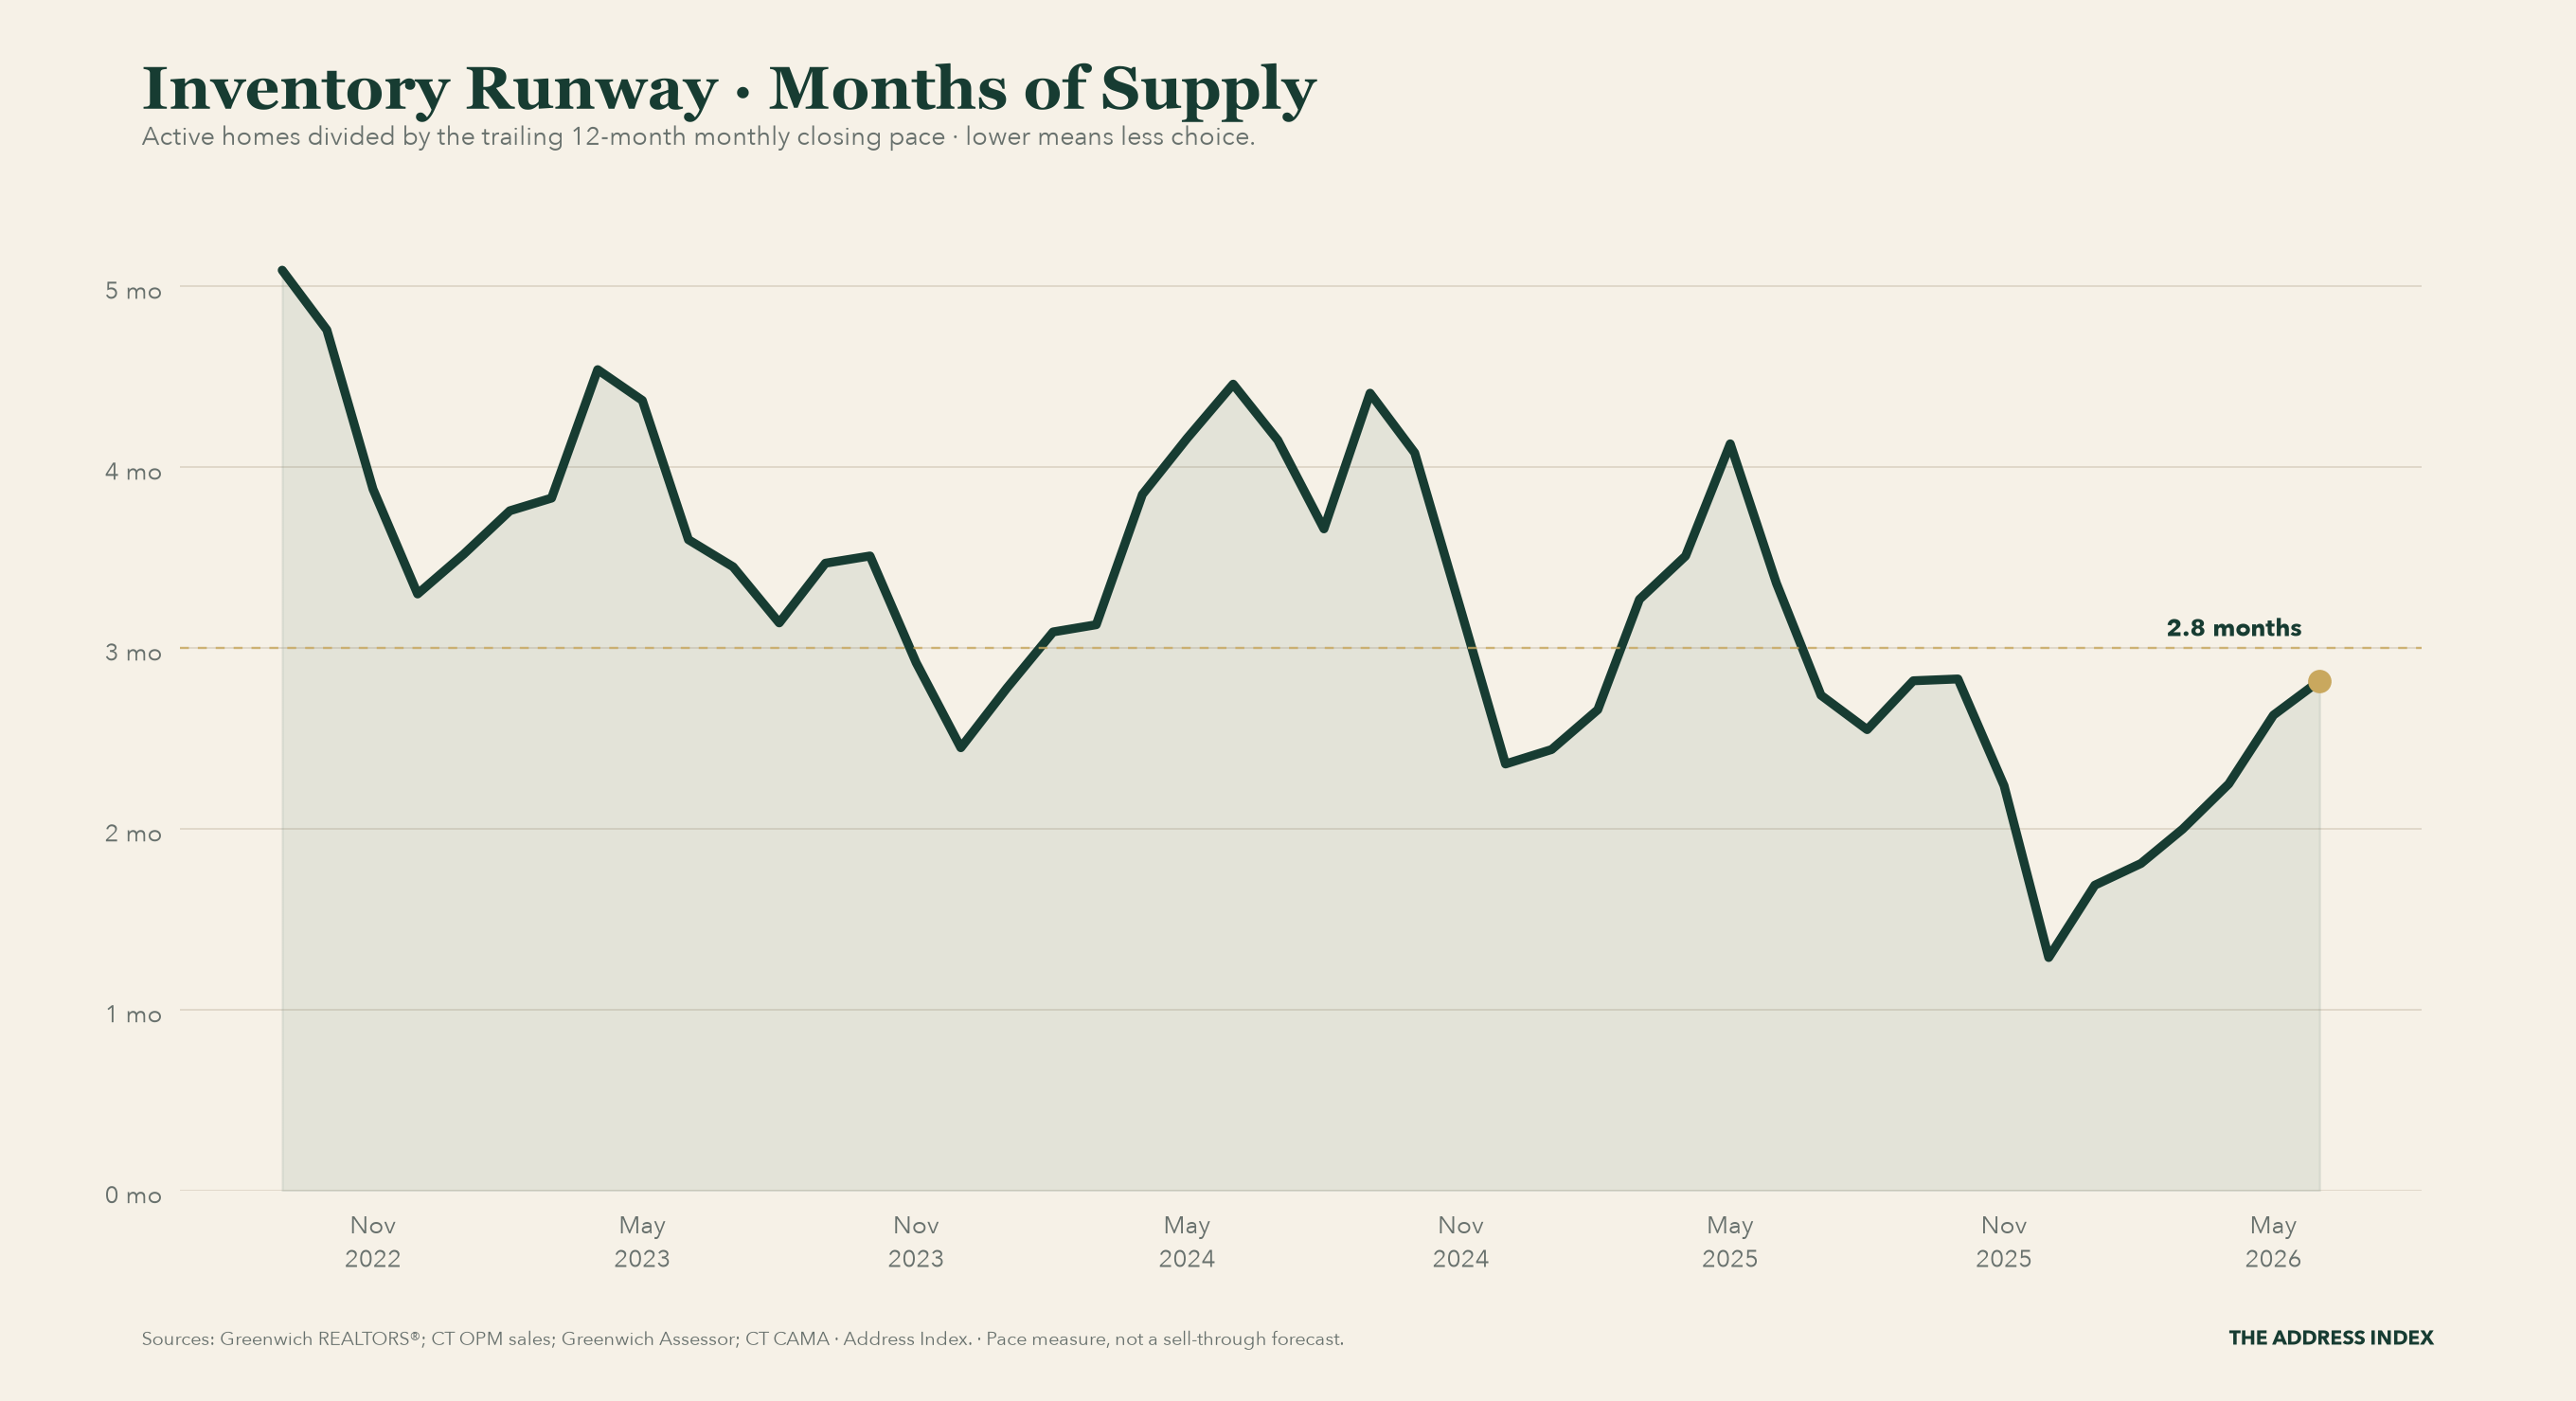
Greenwich ended June 2026 with 122 active single-family homes, equal to 2.8 months of supply at the trailing closing pace. Seasonality makes the pace-adjusted view more useful than the listing count alone.
For buyers: Choice has improved, but the useful question is whether it improved in your price band.
For sellers: More competing listings make launch timing and initial pricing more consequential.
For brokers and advisers: Frame inventory against the closing pace and season, not as an isolated count.
The public-record tape
The highest-signal records in this week’s sweep center on 2 & 10 Greenwich Avenue and 10-12 West Putnam Avenue Greenwich, CT 06830, June 2026 Greenwich Sales and Second Quarter Market Update 2026. The system captured 8 planning applications, 1 Planning & Zoning calendar item, and 2 market reports above our publication threshold.
The source links below are the record. Verify any item before relying on it.
Greenwich market dashboard
Explore this chart interactively →
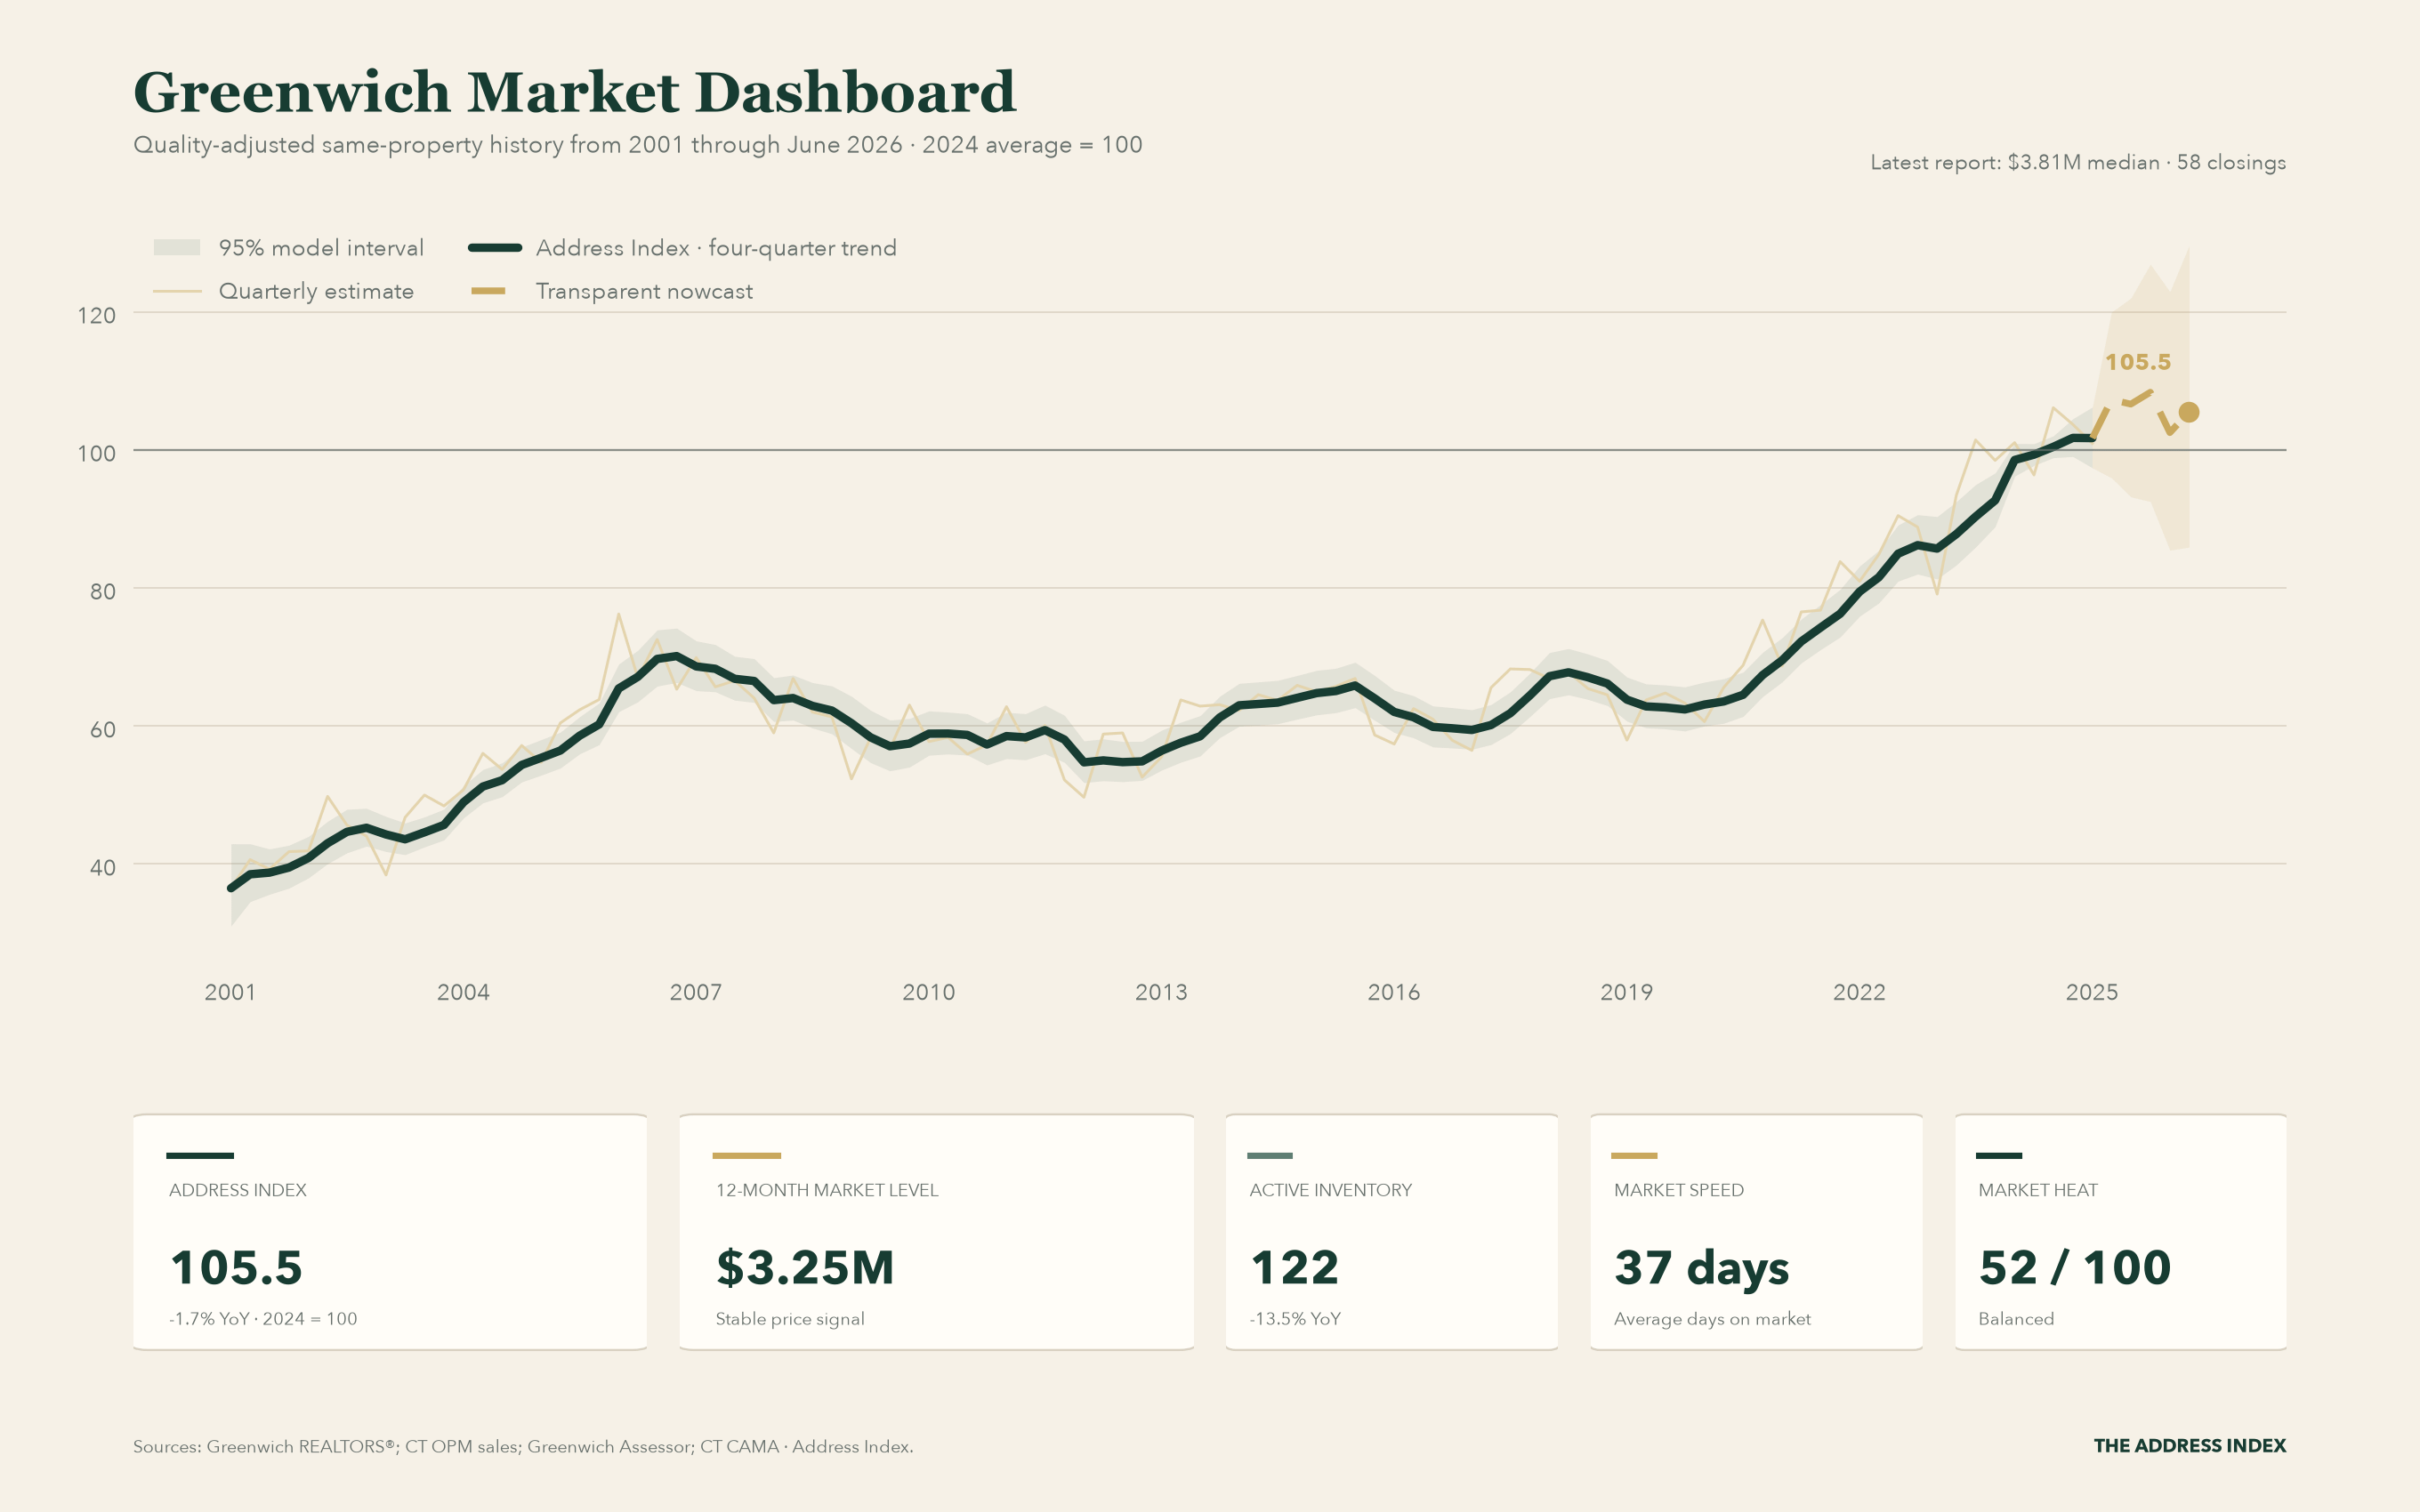
The Address Index Greenwich dashboard, through June 2026. The main chart follows quality-adjusted same-property sales from 2001; the dashed ending is a transparent nowcast after complete public transaction coverage. The separate market-level chart retains recent monthly dollar context.
Address Index: 105.5, -1.7% year over year, with 2024 = 100. The latest point is labeled nowcast.
12-month market level: $3.25M. This is the stable headline signal.
Latest reported monthly median: $3.81M. This is shown as mix-sensitive context, not as the index.
Supply and speed: 122 active single-family homes and 37 average days on market.
Market heat: 52/100 — Balanced.
View the latest underlying market report.
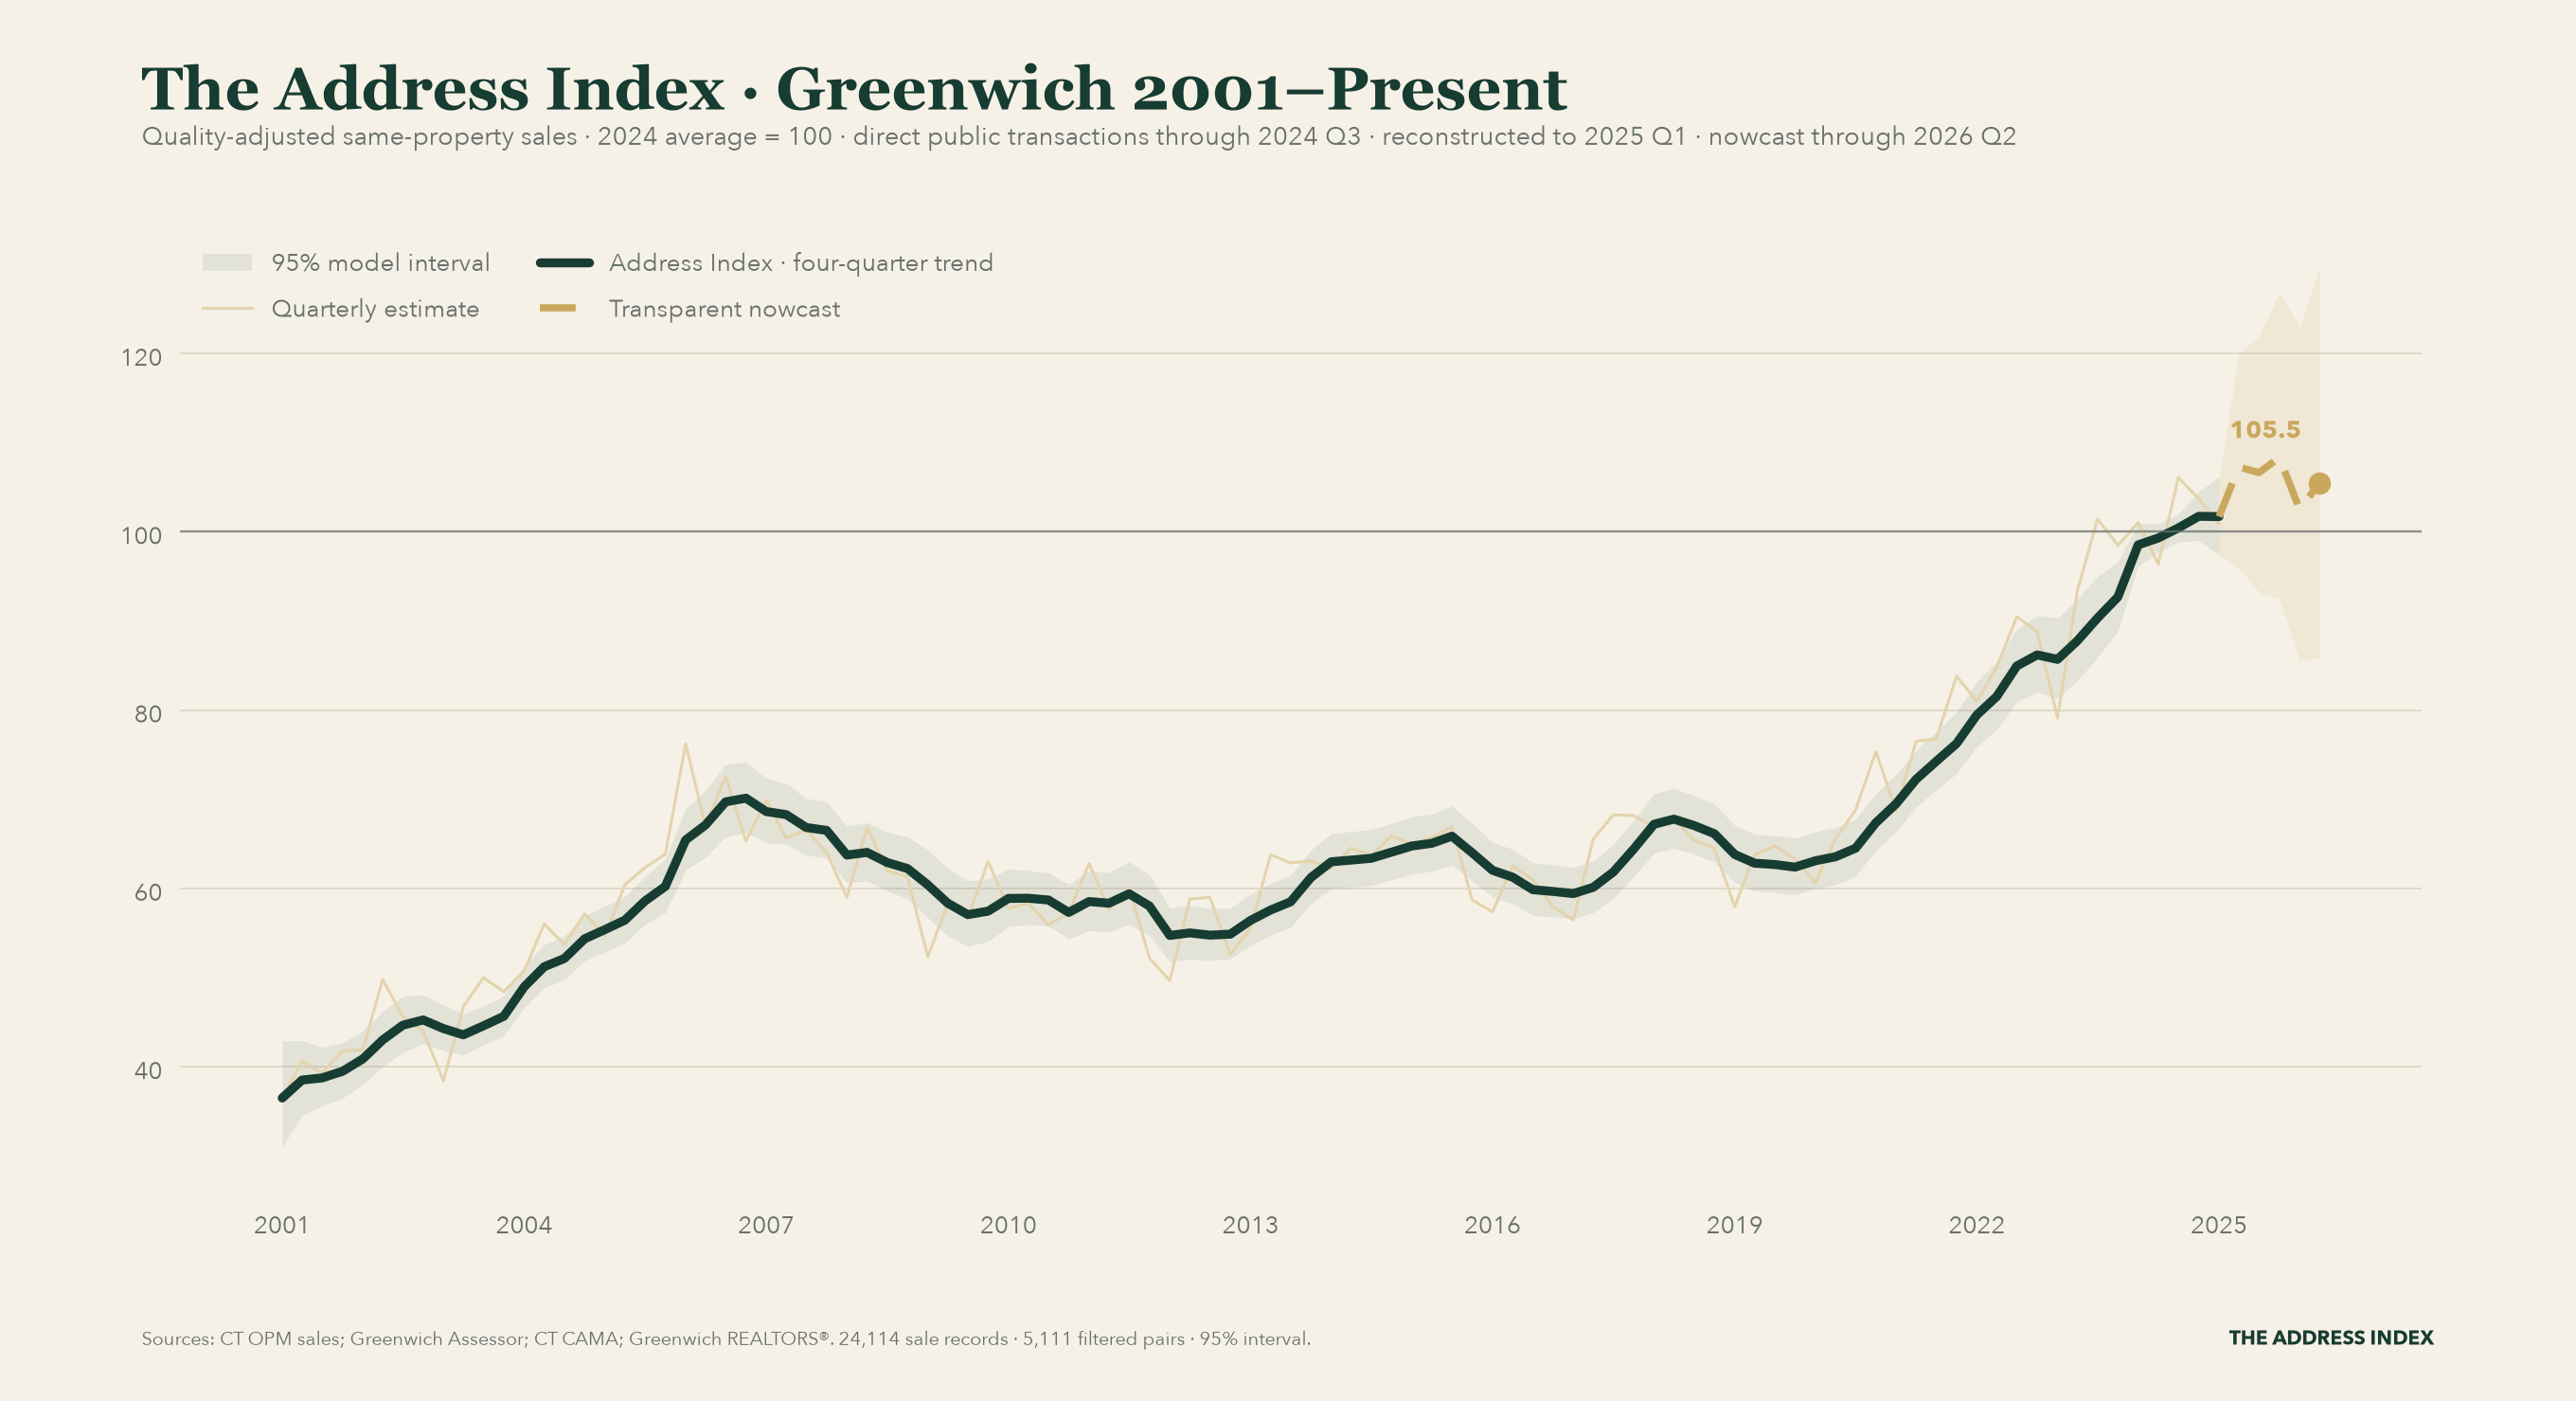
The Address Index reconciles 24,114 public transaction records with parcel sale histories and estimates price change from 5,111 filtered same-property pairs. Direct state transaction coverage runs through 2024 Q3; later quarters are visibly marked reconstructed or nowcast. The 12-month market level is reported separately because it remains sensitive to the mix of homes sold. Neither measure is a property appraisal.
Greenwich since 2001
Explore this chart interactively →
The Address Index uses 24,114 public transaction records and 5,111 filtered same-property pairs. Direct observations run through 2024 Q3; later periods are visibly reconstructed or nowcast.
Synthetic Twin of the Week
Explore this chart interactively →
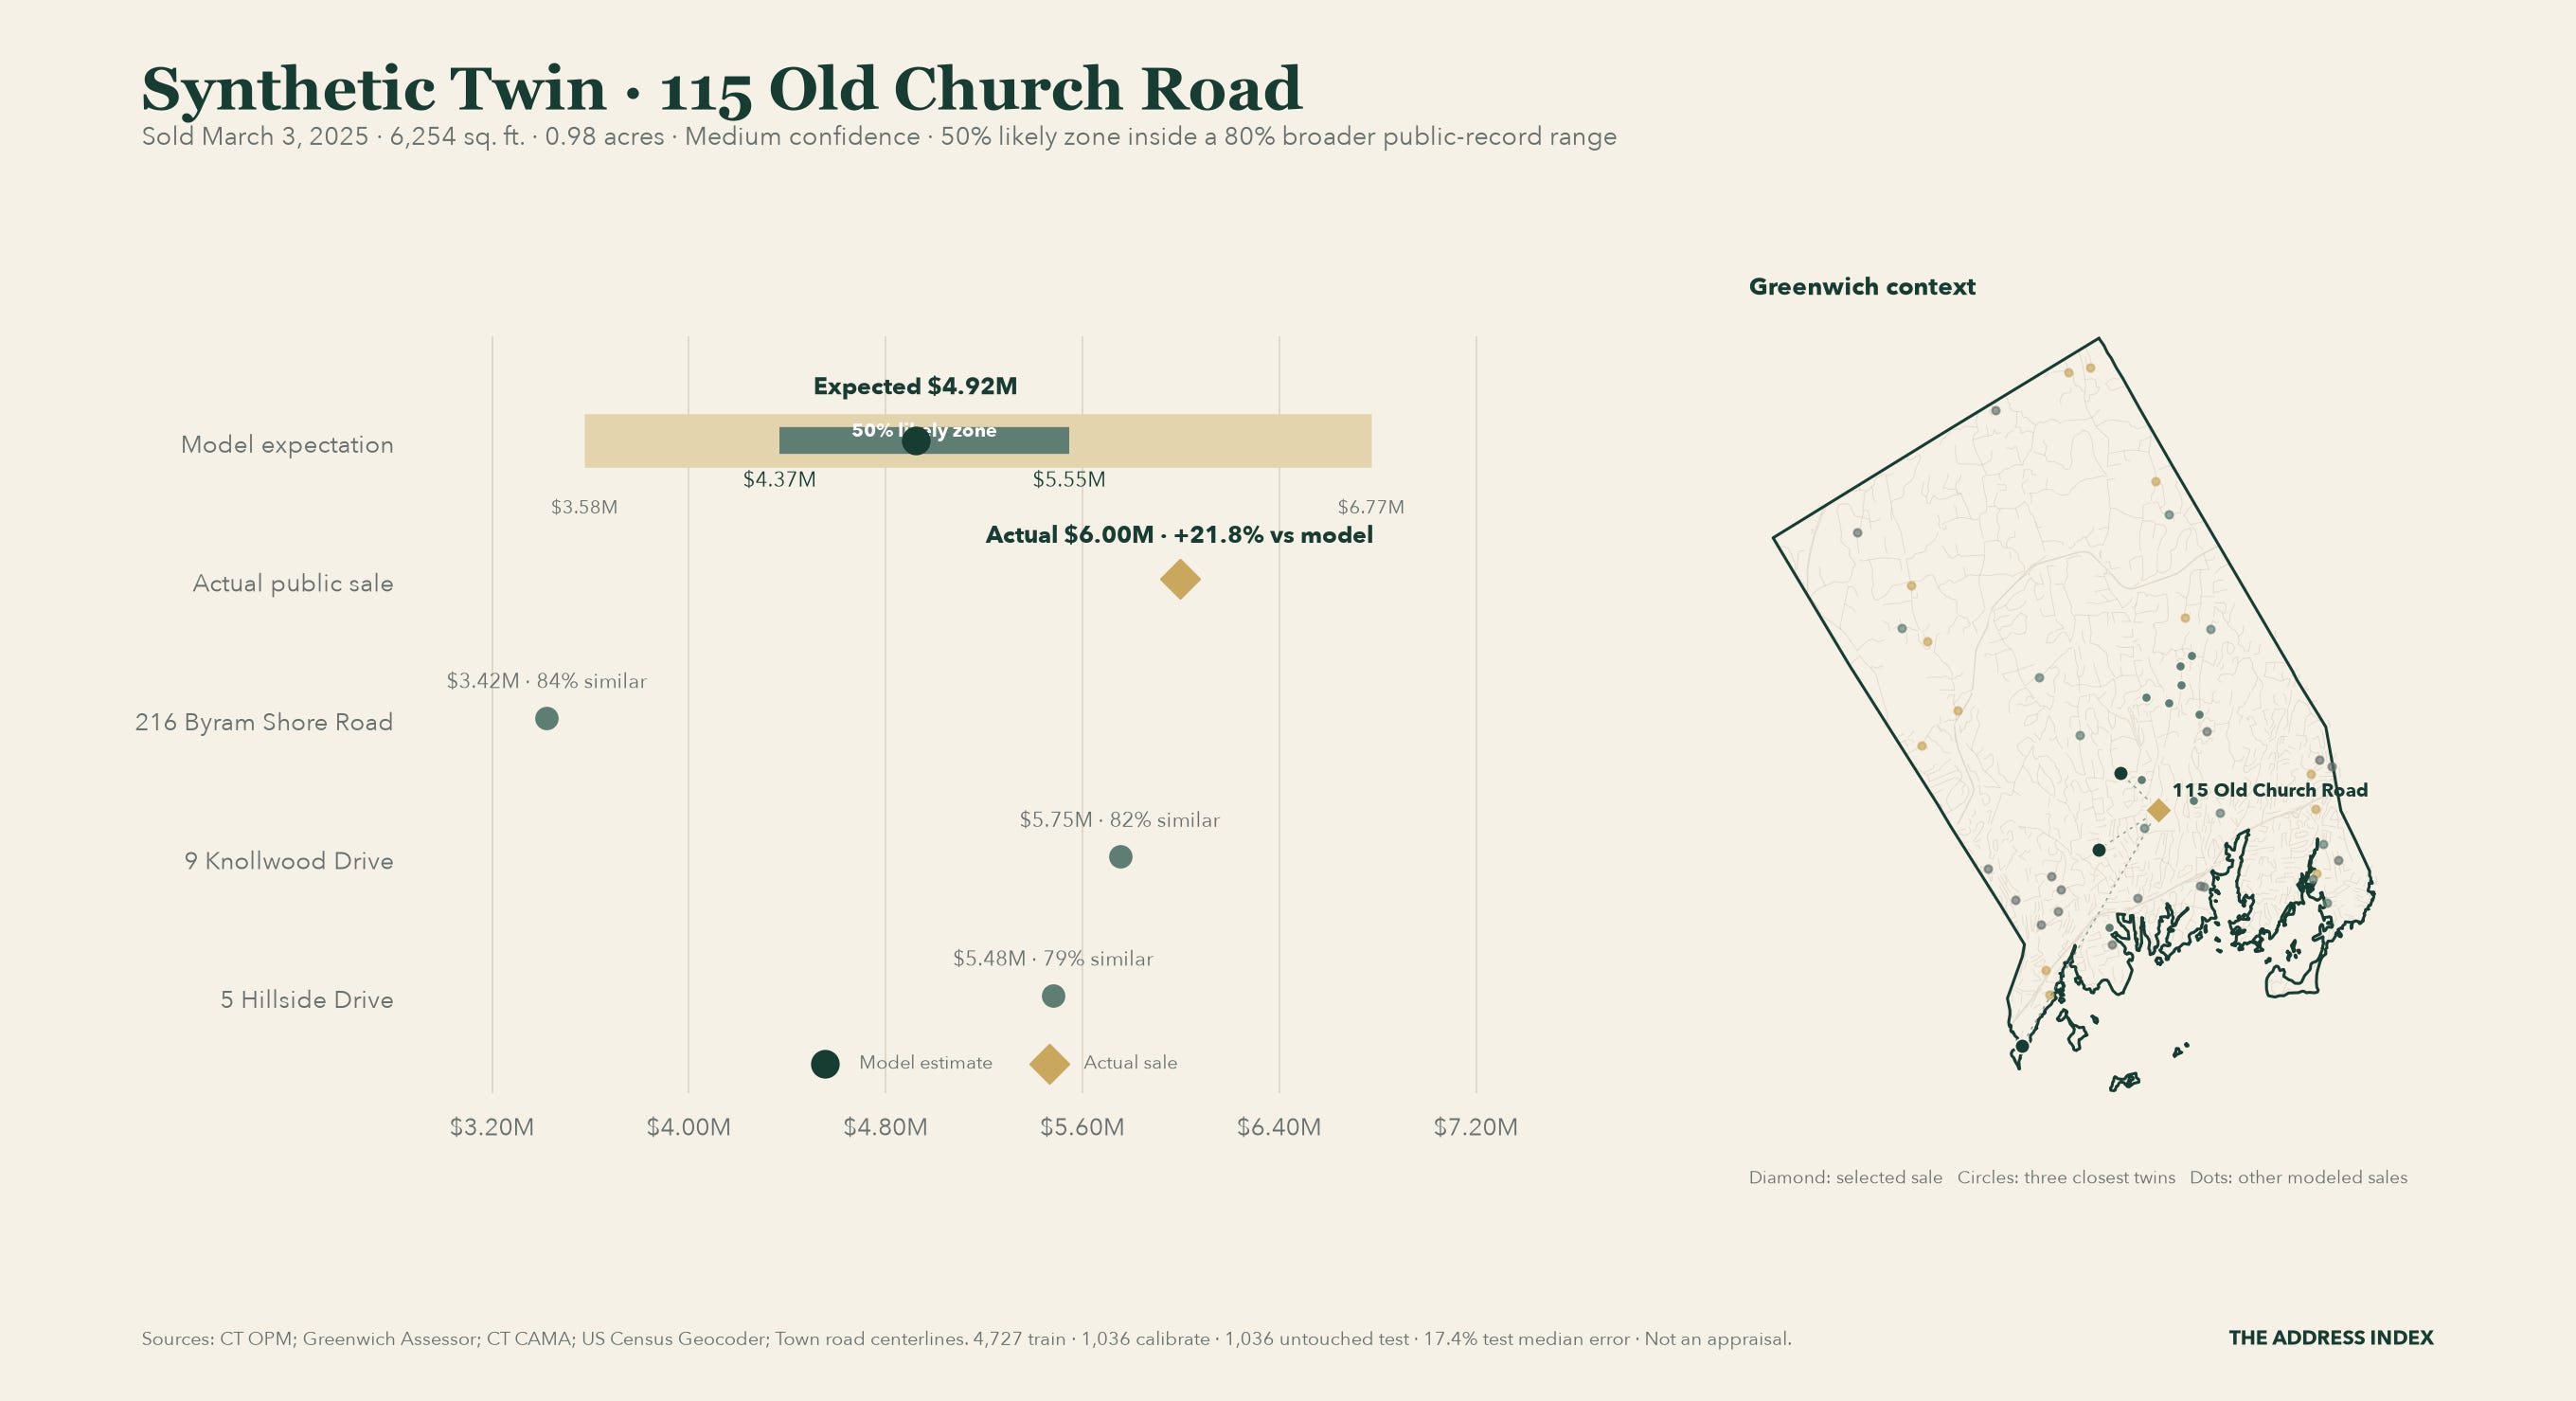
115 Old Church Road sold for $6.00M on March 3, 2025. That was 21.8% above the $4.92M model expectation and outside the likely zone but inside the 80% broader range. The tighter likely zone was $4.37M–$5.55M; the broader range was $3.58M–$6.77M.
Paid members get the adjusted earlier twins, model construction, public inputs, diagnostics, and known unknowns below.
Chart of the week
Explore this chart interactively →
Inventory Runway · Months of Supply. At the recent closing pace, Greenwich’s 122 active single-family homes represented 2.8 months of supply in June 2026. This is a pace estimate, not a prediction that every listed home will sell.
The image carries the week’s headline result. Open the interactive version to inspect every period or property and compare it with the rest of the dashboard library. The analysis below remains part of the paid weekly edition.
Three items to know
1. PLPZ202600241: 2 & 10 Greenwich Avenue and 10-12 West Putnam Avenue Greenwich, CT 06830
Updated · Planning applications
Pre-Application Review for proposed demolition of all structures, consolidation of the 3 lots and development of a single mixed-use building consisting of retail below grade and at the ground floor, and residential apartments on the 2nd and 3rd floors (14 total units)
Why it stands out: A demolition-and-rebuild proposal represents a material potential change to the site, which is why it clears the weekly significance threshold.
Property baseline: Mixed - Use; assessed at $2,604,630; 0.02 acres; 7,165 square feet; last reported sale $8,850,000 on October 14, 2016.
Source: Greenwich pending planning applications.
2. June 2026 Greenwich Sales
Updated · Market pulse
58 single-family closings (-1.69% year over year); single-family median $3,812,500 (-2.24%); 37 average days on market; 22 condo/co-op closings (+57.14% year over year); condo/co-op median $970,000 (+23.17%).
Why it stands out: This official market-wide report helps separate individual-property noise from the broader Greenwich direction.
Source: Greenwich Realtors market reports.
3. Second Quarter Market Update 2026
Updated · Market pulse
144 single-family closings (-8.9% year over year); single-family median $3,655,000 (+15.1%); 49 average days on market; 49 condo/co-op closings; condo/co-op median $1,075,000 (+20.1%).
Why it stands out: This official market-wide report helps separate individual-property noise from the broader Greenwich direction.
Source: Greenwich Realtors market report
